How Australia Uses Claude: Findings from the Anthropic Economic Index

Anthropic is expanding to Australia. We’re opening a new office in Sydney in the coming weeks, and we’ve signed a Memorandum of Understanding with the Australian government to cooperate on AI safety research and support the goals of Australia’s National AI Plan. To mark the occasion, we thought we’d look more closely into how Australians are using Claude.
Key Findings
- Australia is among the leading adopters of Claude, accounting for 1.6% of global Claude.ai traffic. Per capita, Australians’ use of Claude is more than four times higher than expected for the size of its population.
- Adoption within Australia is concentrated in two states: New South Wales (37% of conversations) and Victoria (31%). Per capita Claude usage is lower in every other state and territory.
- Australia's mix of use-cases generally tracks with its Anglosphere peers: 46% of Claude conversations are for work, 7% for coursework, 47% for personal use. This is a profile typical of high-income, high-adoption economies.
- But Australia’s mix of tasks is more diverse. Like other countries, Computer & Mathematical tasks remain the single largest category in our dataset—but this category is about 8 percentage points below the global baseline. It’s offset by higher-than-average volumes of office, sales, management, and personal life tasks.
- Users in Australia tend to prompt Claude for more complex tasks, as measured by the estimated years of schooling required to understand the prompt. At the same time, we estimate that the length of time these tasks would’ve taken without AI is roughly 20% less than average. In other words, relative to how the rest of the world uses Claude, Australians’ tasks are associated with a higher education level but a shorter duration.
- Like many other high-adoption economies, Australia registers as having a relatively low “AI autonomy” score (3.38 on a 1–5 scale), which suggests that Australians use Claude in more collaborative, less delegated ways.
High adoption overall, unevenly distributed across states and territories
Australia accounts for 1.6% of global Claude.ai traffic, ranking eleventh among all countries in our February 2026 sample (Figure 1). Its Anthropic AI Usage Index (AUI) is 4.1, which means Australians use Claude over four times more than its working-age population would predict. This places Australia among the highest per capita adopters of Claude with ranking seventh behind Singapore, Israel, Luxembourg, Switzerland, the United States, and Canada.
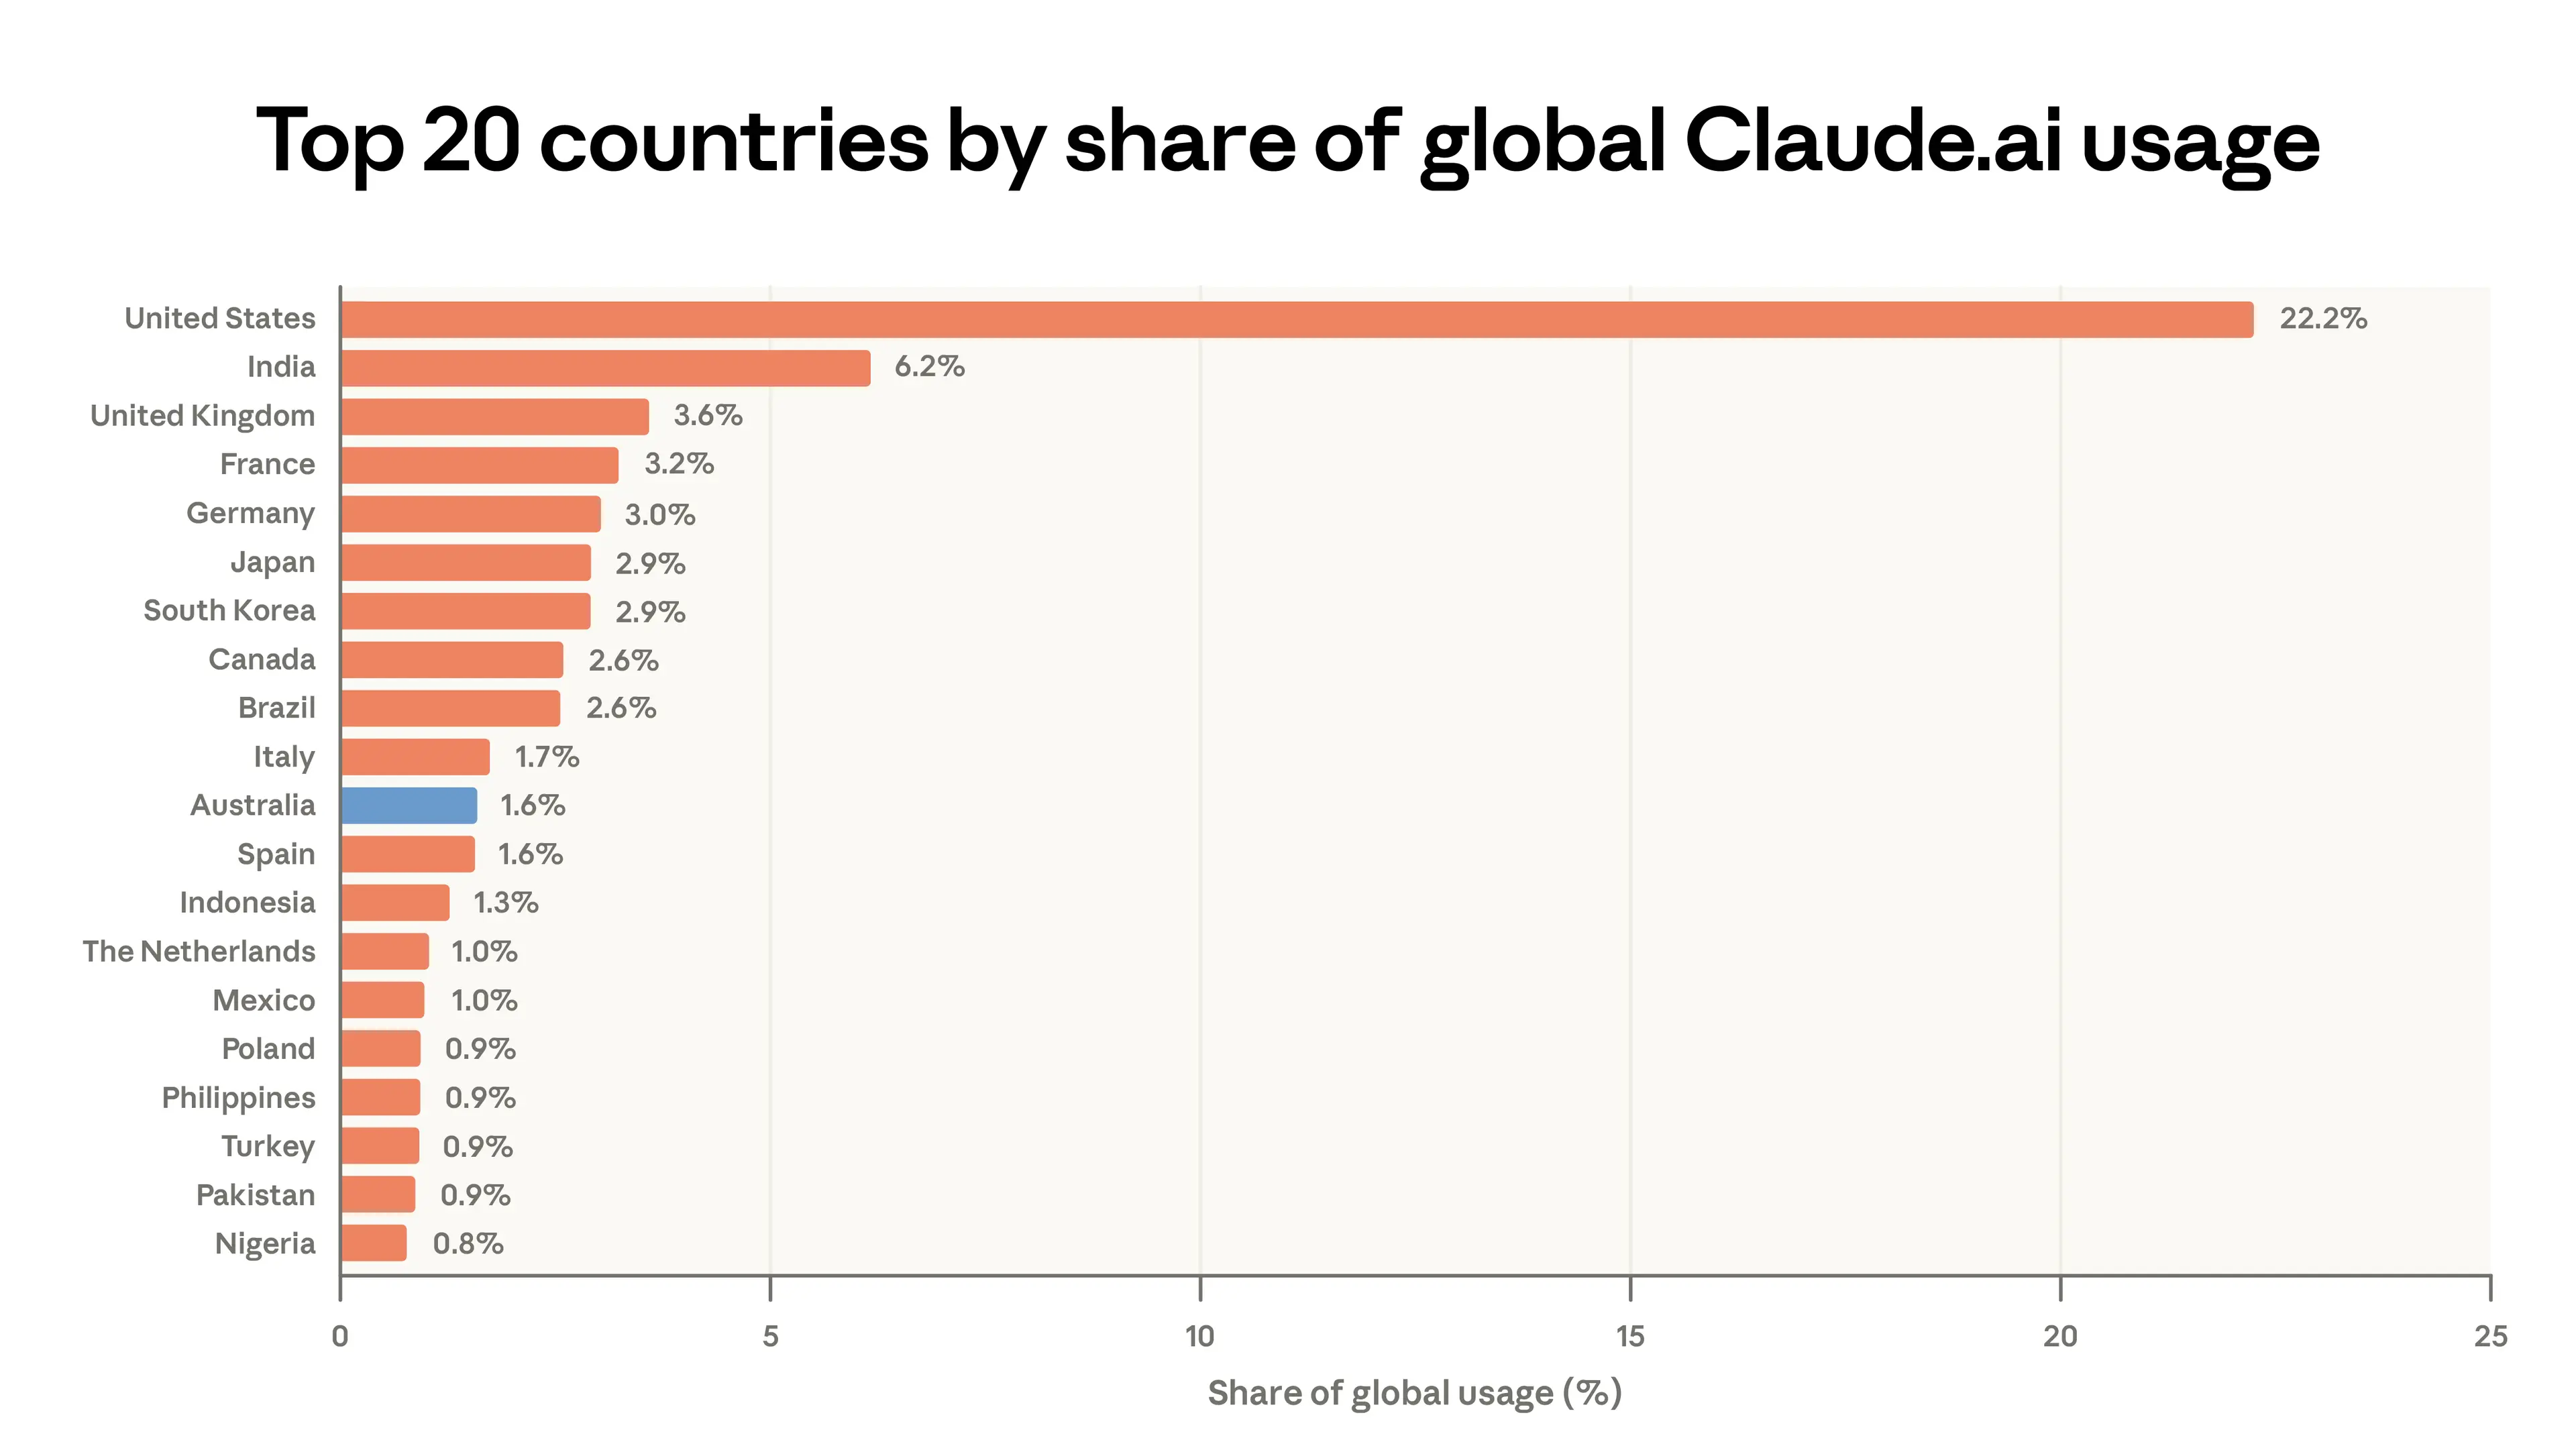
Australia accounts for 1.6% of global Claude.ai consumer use at rank 11. Bars show each country’s share of the 1M conversations sampled from Claude.ai in February 2026. Australia highlighted in blue.
Within Australia, usage is concentrated in the most populous states. New South Wales accounts for 37.2% of conversations, followed by Victoria at 30.8%, Queensland at 17.7%, and the remaining states and territories at a combined 14% (Figure 2). States and territories’ working age population size explains much of this ordering. However, adjusting for this, New South Wales has an AUI of 1.20 and Victoria an AUI of 1.19. These are the only two states with higher than expected per capita adoption; every other state or territory has an AUI below 1, with adoption lowest in Western Australia at 0.68, Tasmania at 0.32, and the Northern Territory at 0.12.
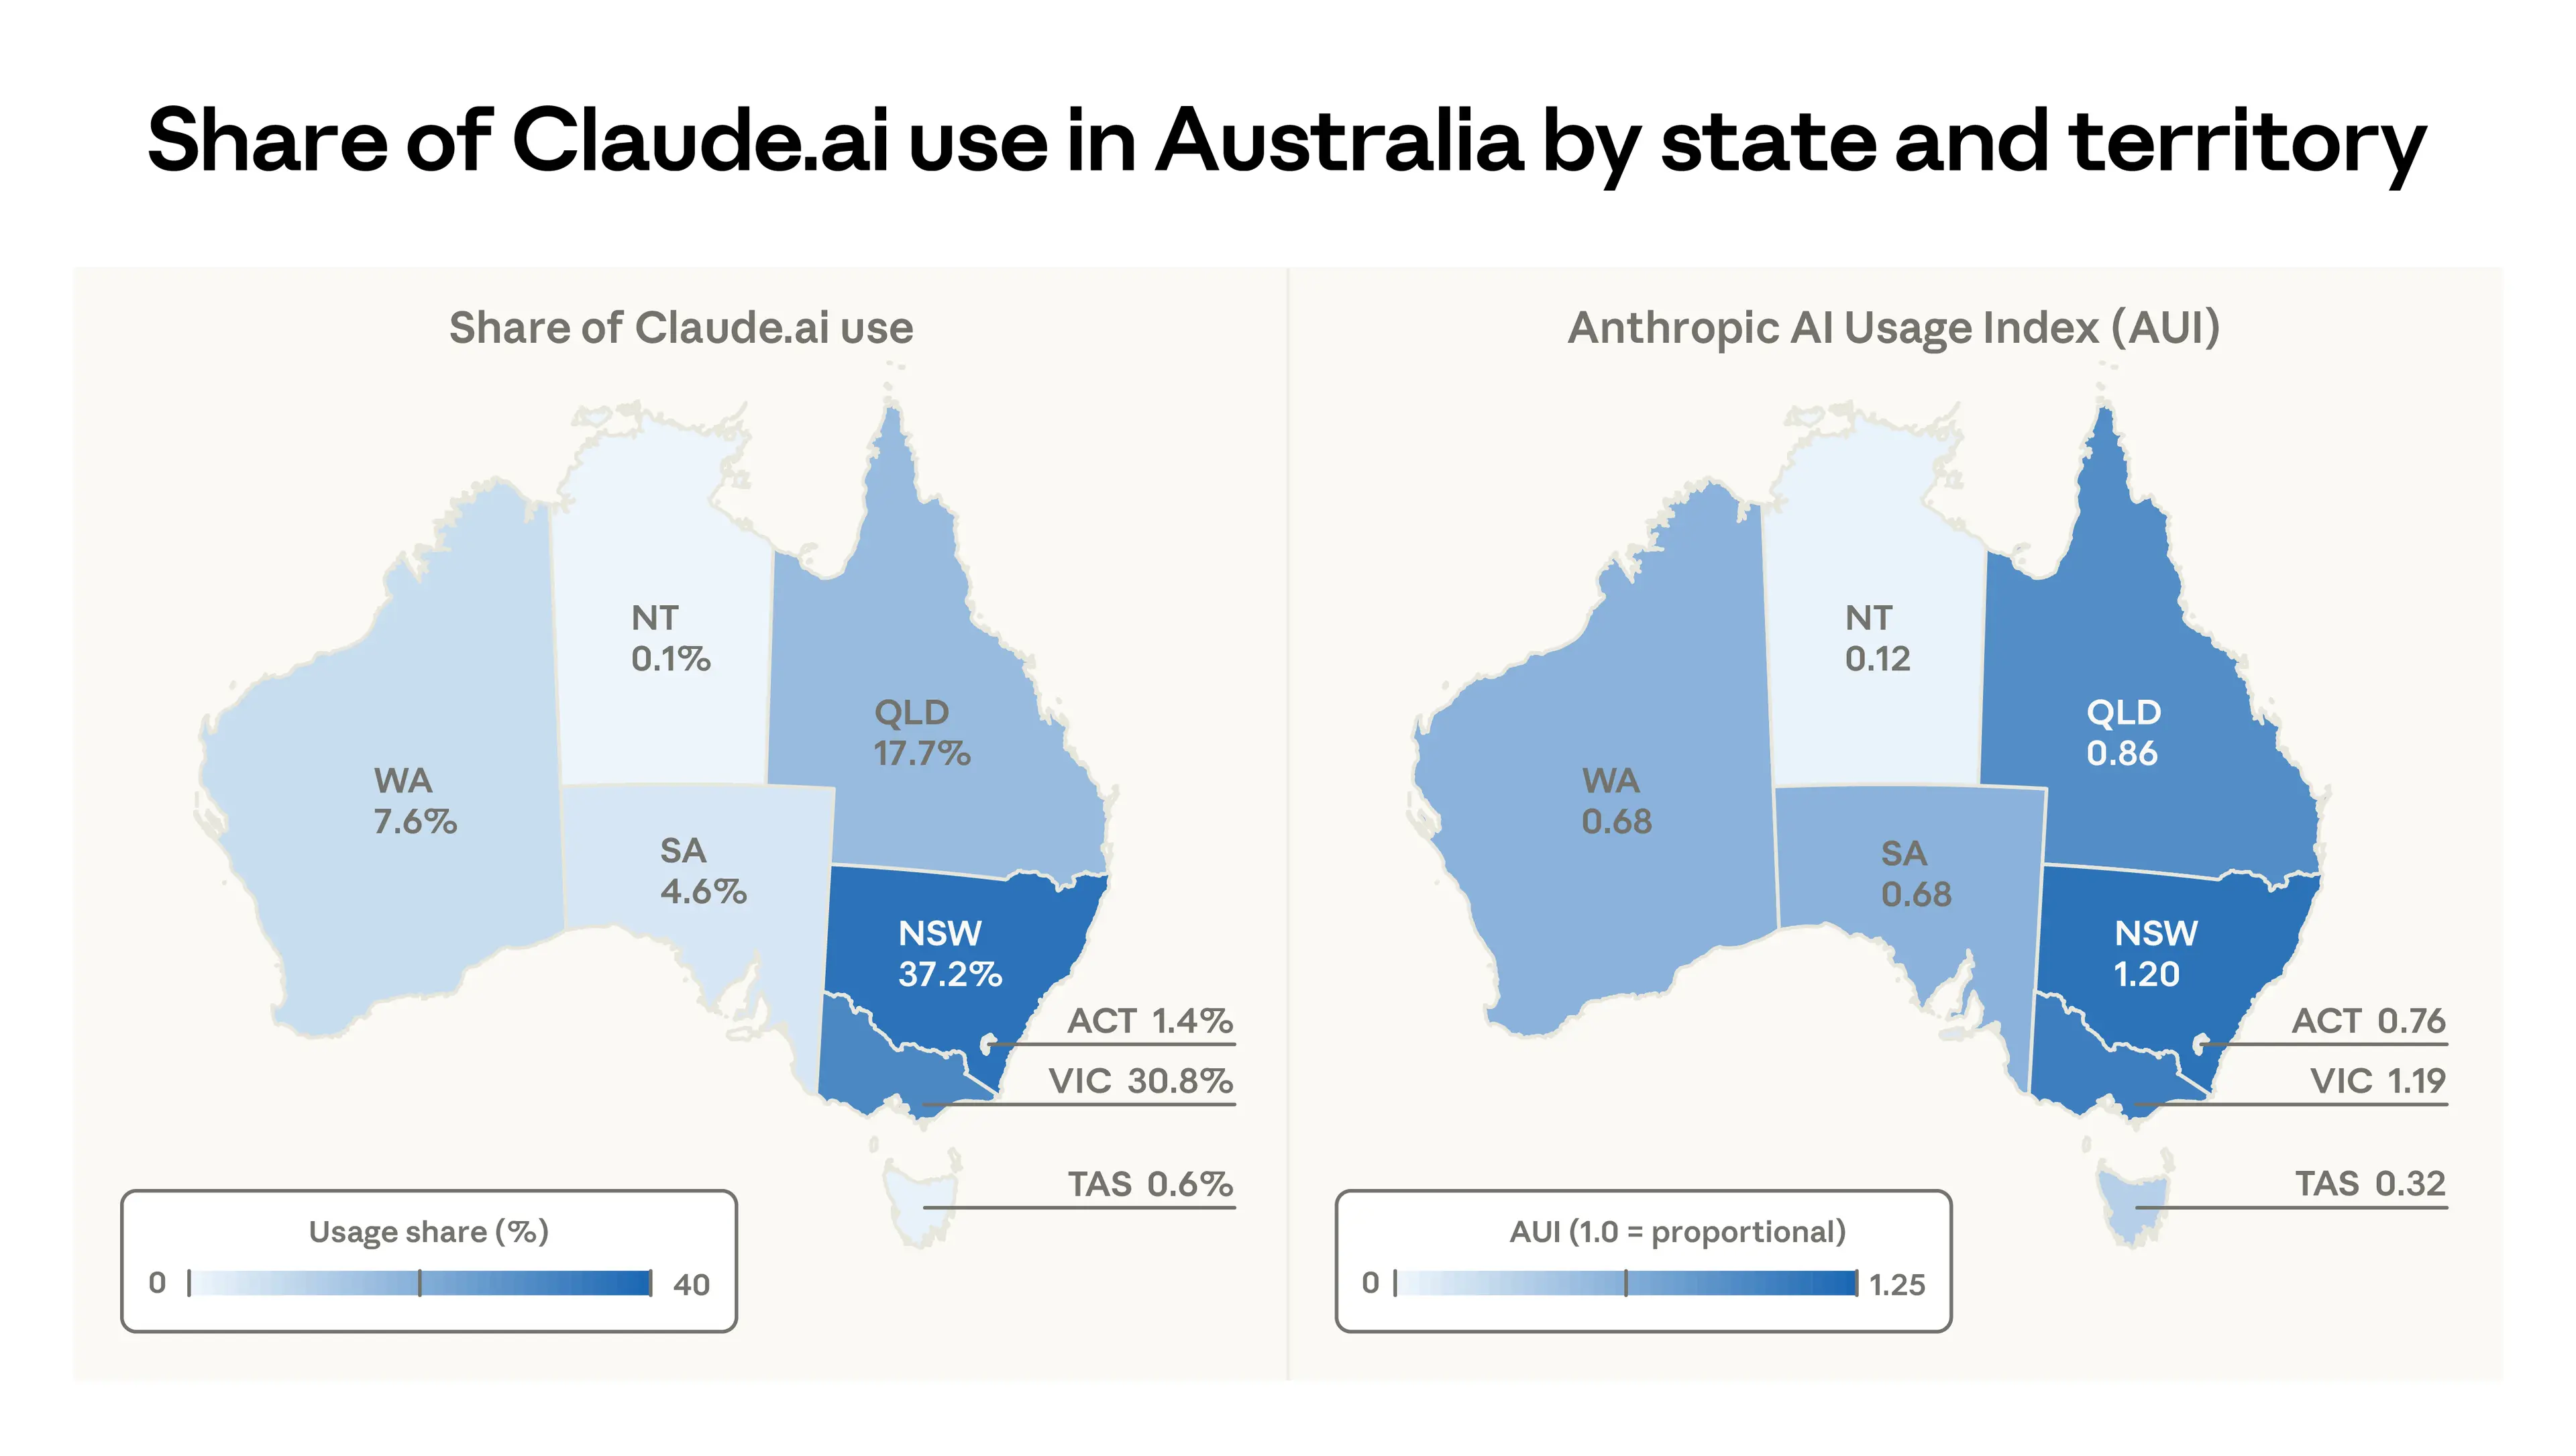
New South Wales accounts for the largest share of Australia's Claude.ai use (37.2%), followed by Victoria (30.8%), Queensland (17.7%), Western Australia (7.6%), South Australia (4.6%), the Australian Capital Territory (1.4%), Tasmania (0.6%), and the Northern Territory (0.1%). Data from February 2026.
In contrast to the strong association between income and Claude usage per capita we observe across countries, income does not appear to predict adoption across Australian states and territories (Figure 3). That said, since we can only compare across the eight, the lack of correlation between income and usage is suggestive rather than conclusive.
Local workforce composition is a likely factor for why adoption appears decoupled from income across Australian states and territories: mining-heavy Western Australia, the state with the highest GSP per capita, has low usage per capita. The Northern Territory likewise has high GSP per capita and low AUI. This likely reflects these sparsely populated states and territories having a relatively smaller share of workers in occupations where Claude tends to be adopted. The Australian Capital Territory has above average income but lower-than-expected Claude usage per capita, which may reflect barriers to adoption among its large public sector workforce. The two states with the greatest adoption, New South Wales and Victoria, have slightly below average income; high adoption in these states likely reflects the higher share of workers in finance, professional services, and tech sectors, where Claude usage tends to be higher.
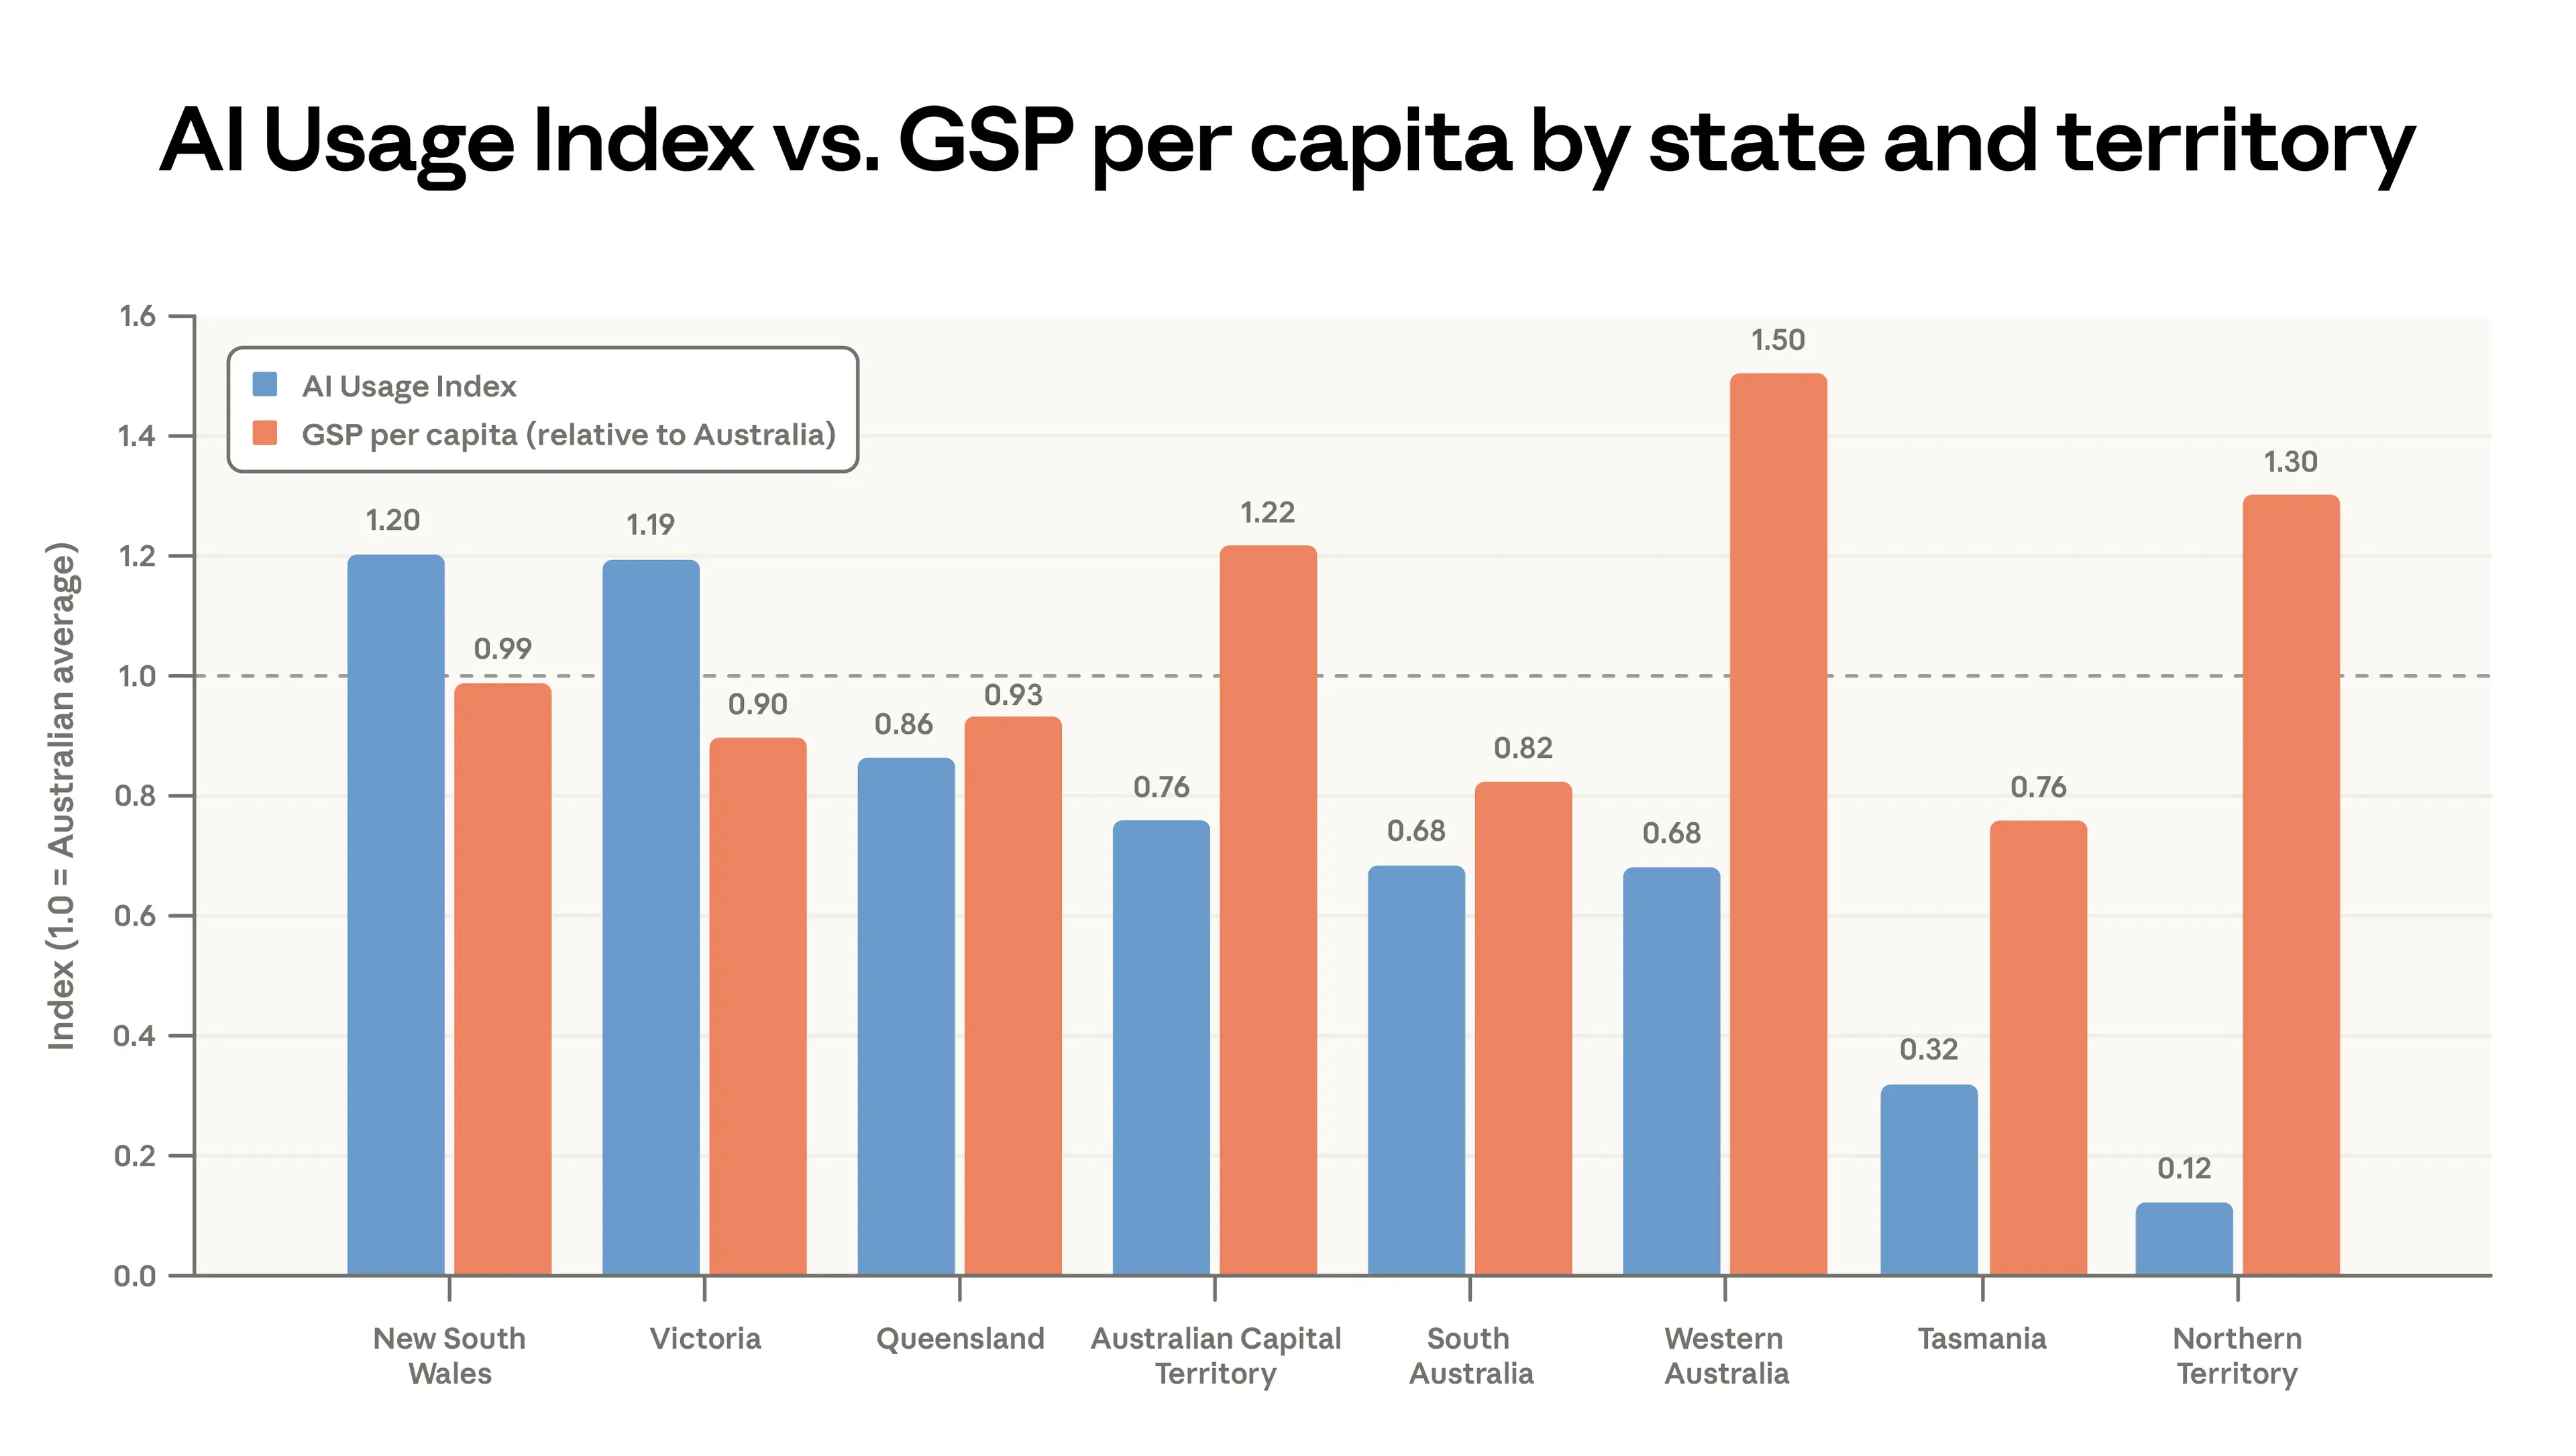
Each state's AUI is shown alongside its gross state product per capita, expressed relative to the Australian average ($101,438); both are indexed so that 1.0 represents parity. States and territories are ordered by AUI. Sources: Anthropic Economic Index, February 2026; ABS Estimated Resident Population, June quarter 2025; ABS Australian National Accounts: State Accounts, 2024–25.
Australia's use of Claude resembles its Anglosphere peers
Our fourth Economic Index report introduced four economic primitives: the use-case mix, the degree of autonomy afforded to Claude, task success, and task complexity. Figure 4 shows where Australia falls on each of these relative to other Anglosphere countries (in orange), other high-adoption economies (in grey), and all countries in our sample (in purple).
In terms of how Claude is used, Australia is similar to its Anglosphere peers. 46% of Australian conversations are classified as work-related, close to the median and in the middle of the Anglosphere range. Coursework accounts for 7% of Australian use, which is toward the bottom of the distribution (and below the US, UK, and Canada); countries with lower per capita adoption show coursework shares two to three times as high. The share of conversations that are for personal use, at 47%, is near the top of the distribution.
This pattern for Australia is consistent with the relationship we documented in our economic primitives report between per capita income and use cases: richer countries tend to have lower coursework shares and higher personal use shares.
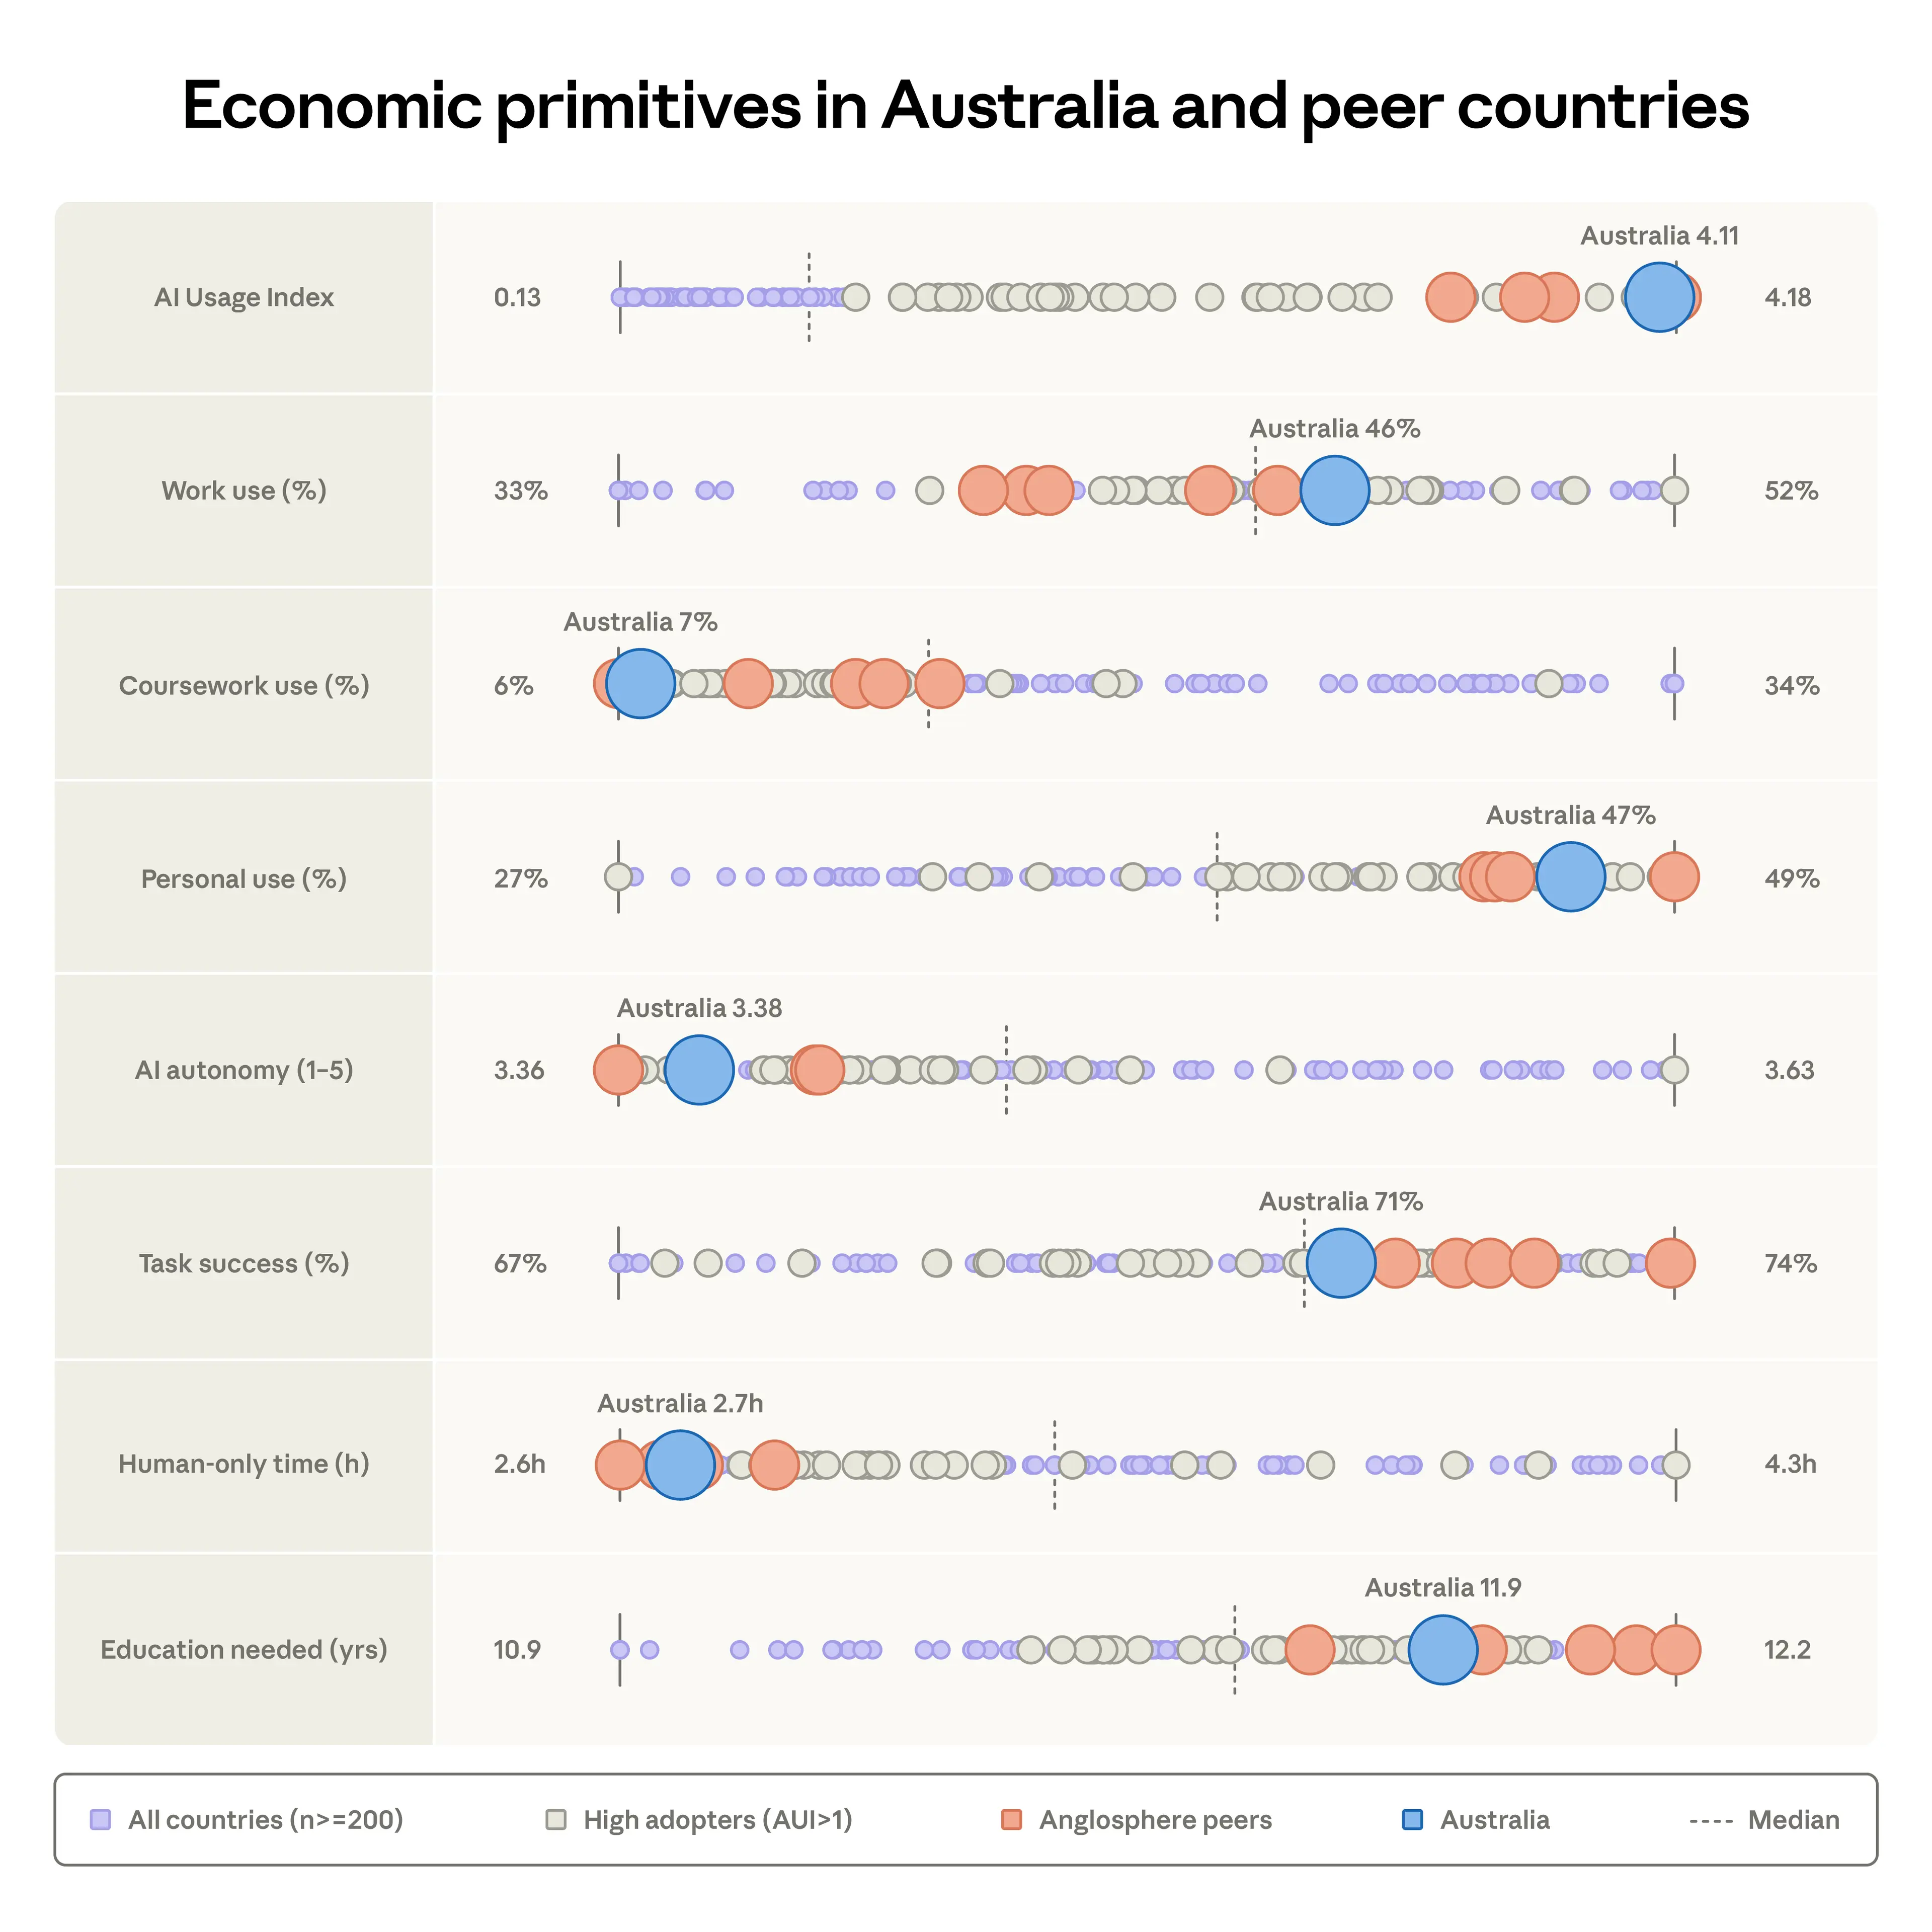
This figure shows the value of various economic primitives in Australia as compared to peer countries. The large blue dot represents Australia. Orange dots correspond to other Anglosphere countries (USA, UK, Canada, New Zealand, Ireland). Grey dots are countries with at least 200 sampled conversations from Claude.ai and with an Anthropic AI Usage Index (AUI) above 1. Small purple dots represent all other countries with at least 200 sampled conversations.
Australia registers toward the low end of AI autonomy, at 3.38 on a 1–5 scale, with other Anglosphere countries close by. Lower autonomy indicates that users retain more decision-making control in their conversations, rather than delegating fully to the model. This is consistent with high-adoption economies tending to use Claude in more collaborative, less directive ways.
Australia sits below the median on one measure of task complexity, but toward the top on another. Australia’s average task itself is relatively less time-intensive: it would take a skilled professional an estimated 2.7 hours to complete the task without AI, compared to the cross-country average of 3.3 hours. But prompts from Australian users are estimated to require 11.9 years of schooling to understand, which is comparable to other Anglosphere countries and above the global median. Both patterns are consistent with the cross-country relationships we documented in our January Economic Index report, where the intensity of Claude adoption correlates positively with human prompt sophistication and negatively with estimates of the “no-AI” task duration.
In Australia, a broader task mix with a smaller coding share
Australia's Claude use is more diverse than usage among peer Anglosphere countries and relative to the broader global average. Figure 5 shows the share of each geography's usage that is covered by its 100 most common tasks (where tasks are classified according to O*NET, a taxonomy of tasks that characterize jobs throughout the economy). Lower values on this figure indicate that Claude is used for a wider range of tasks, since the top 100 occupy a smaller share. Australia's top 100 tasks account for 47.3% of its usage, below the US (47.7%), the UK (48.3%), and Canada (50.2%), and five percentage points below the global figure of 52.3%.
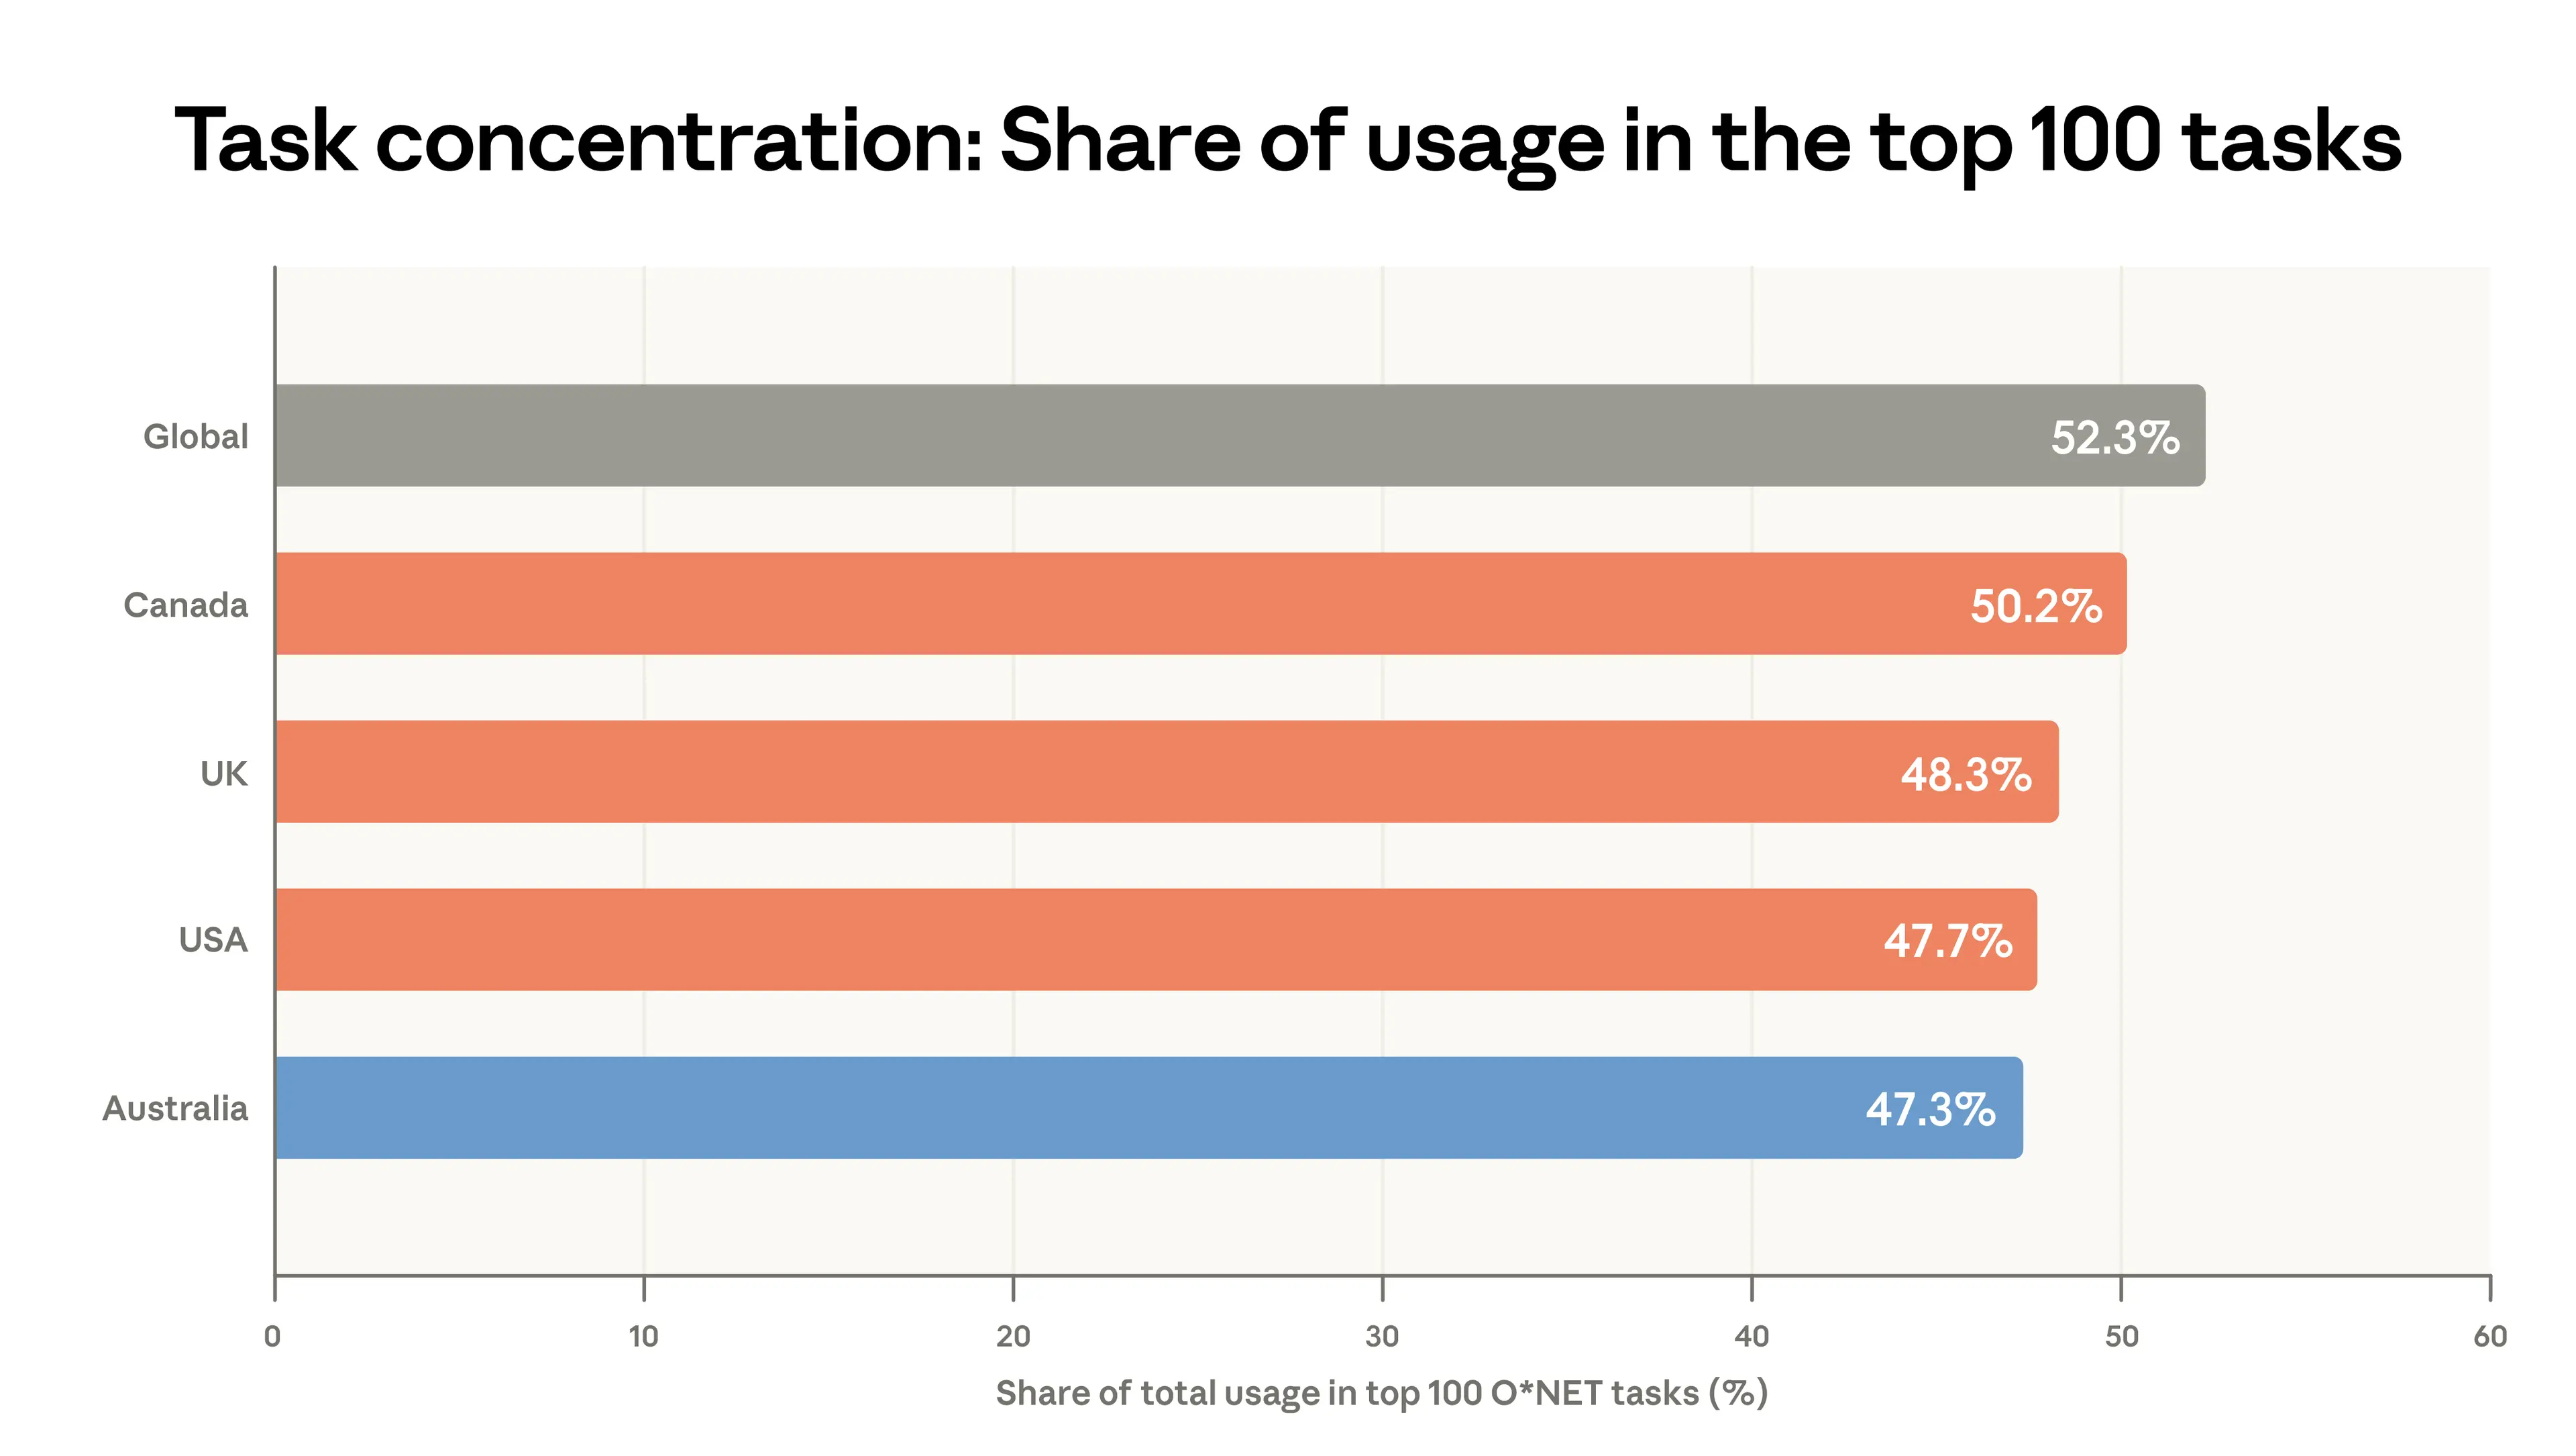
This figure shows how concentrated each geography's Claude.ai usage is, measured as the share of classified usage captured by that geography's 100 most-common O*NET tasks. Lower values indicate a more diverse spread of uses. Among Anglosphere countries, New Zealand and Ireland are omitted because fewer than 100 distinct tasks were observed. Source: Anthropic Economic Index, February 2026.
The broader diversity of usage within Australia comes mostly from a lower share of coding-related tasks. Figure 6 shows how the composition of Australia's top 100 tasks differs from the global top 100 by SOC major group (broad occupation categories defined by the US Bureau of Labor Statistics). Computer and Mathematical tasks are 8.0 percentage points lower in Australia. No other category of use approaches that magnitude of difference to the global average, though education-related tasks are nearly three percentage points below global parity. The offsetting positives are spread across many groups, led by Management (+2.3pp), Office and Administrative Support (+1.3pp) and Life, Physical, and Social Science occupations (+1.3pp).
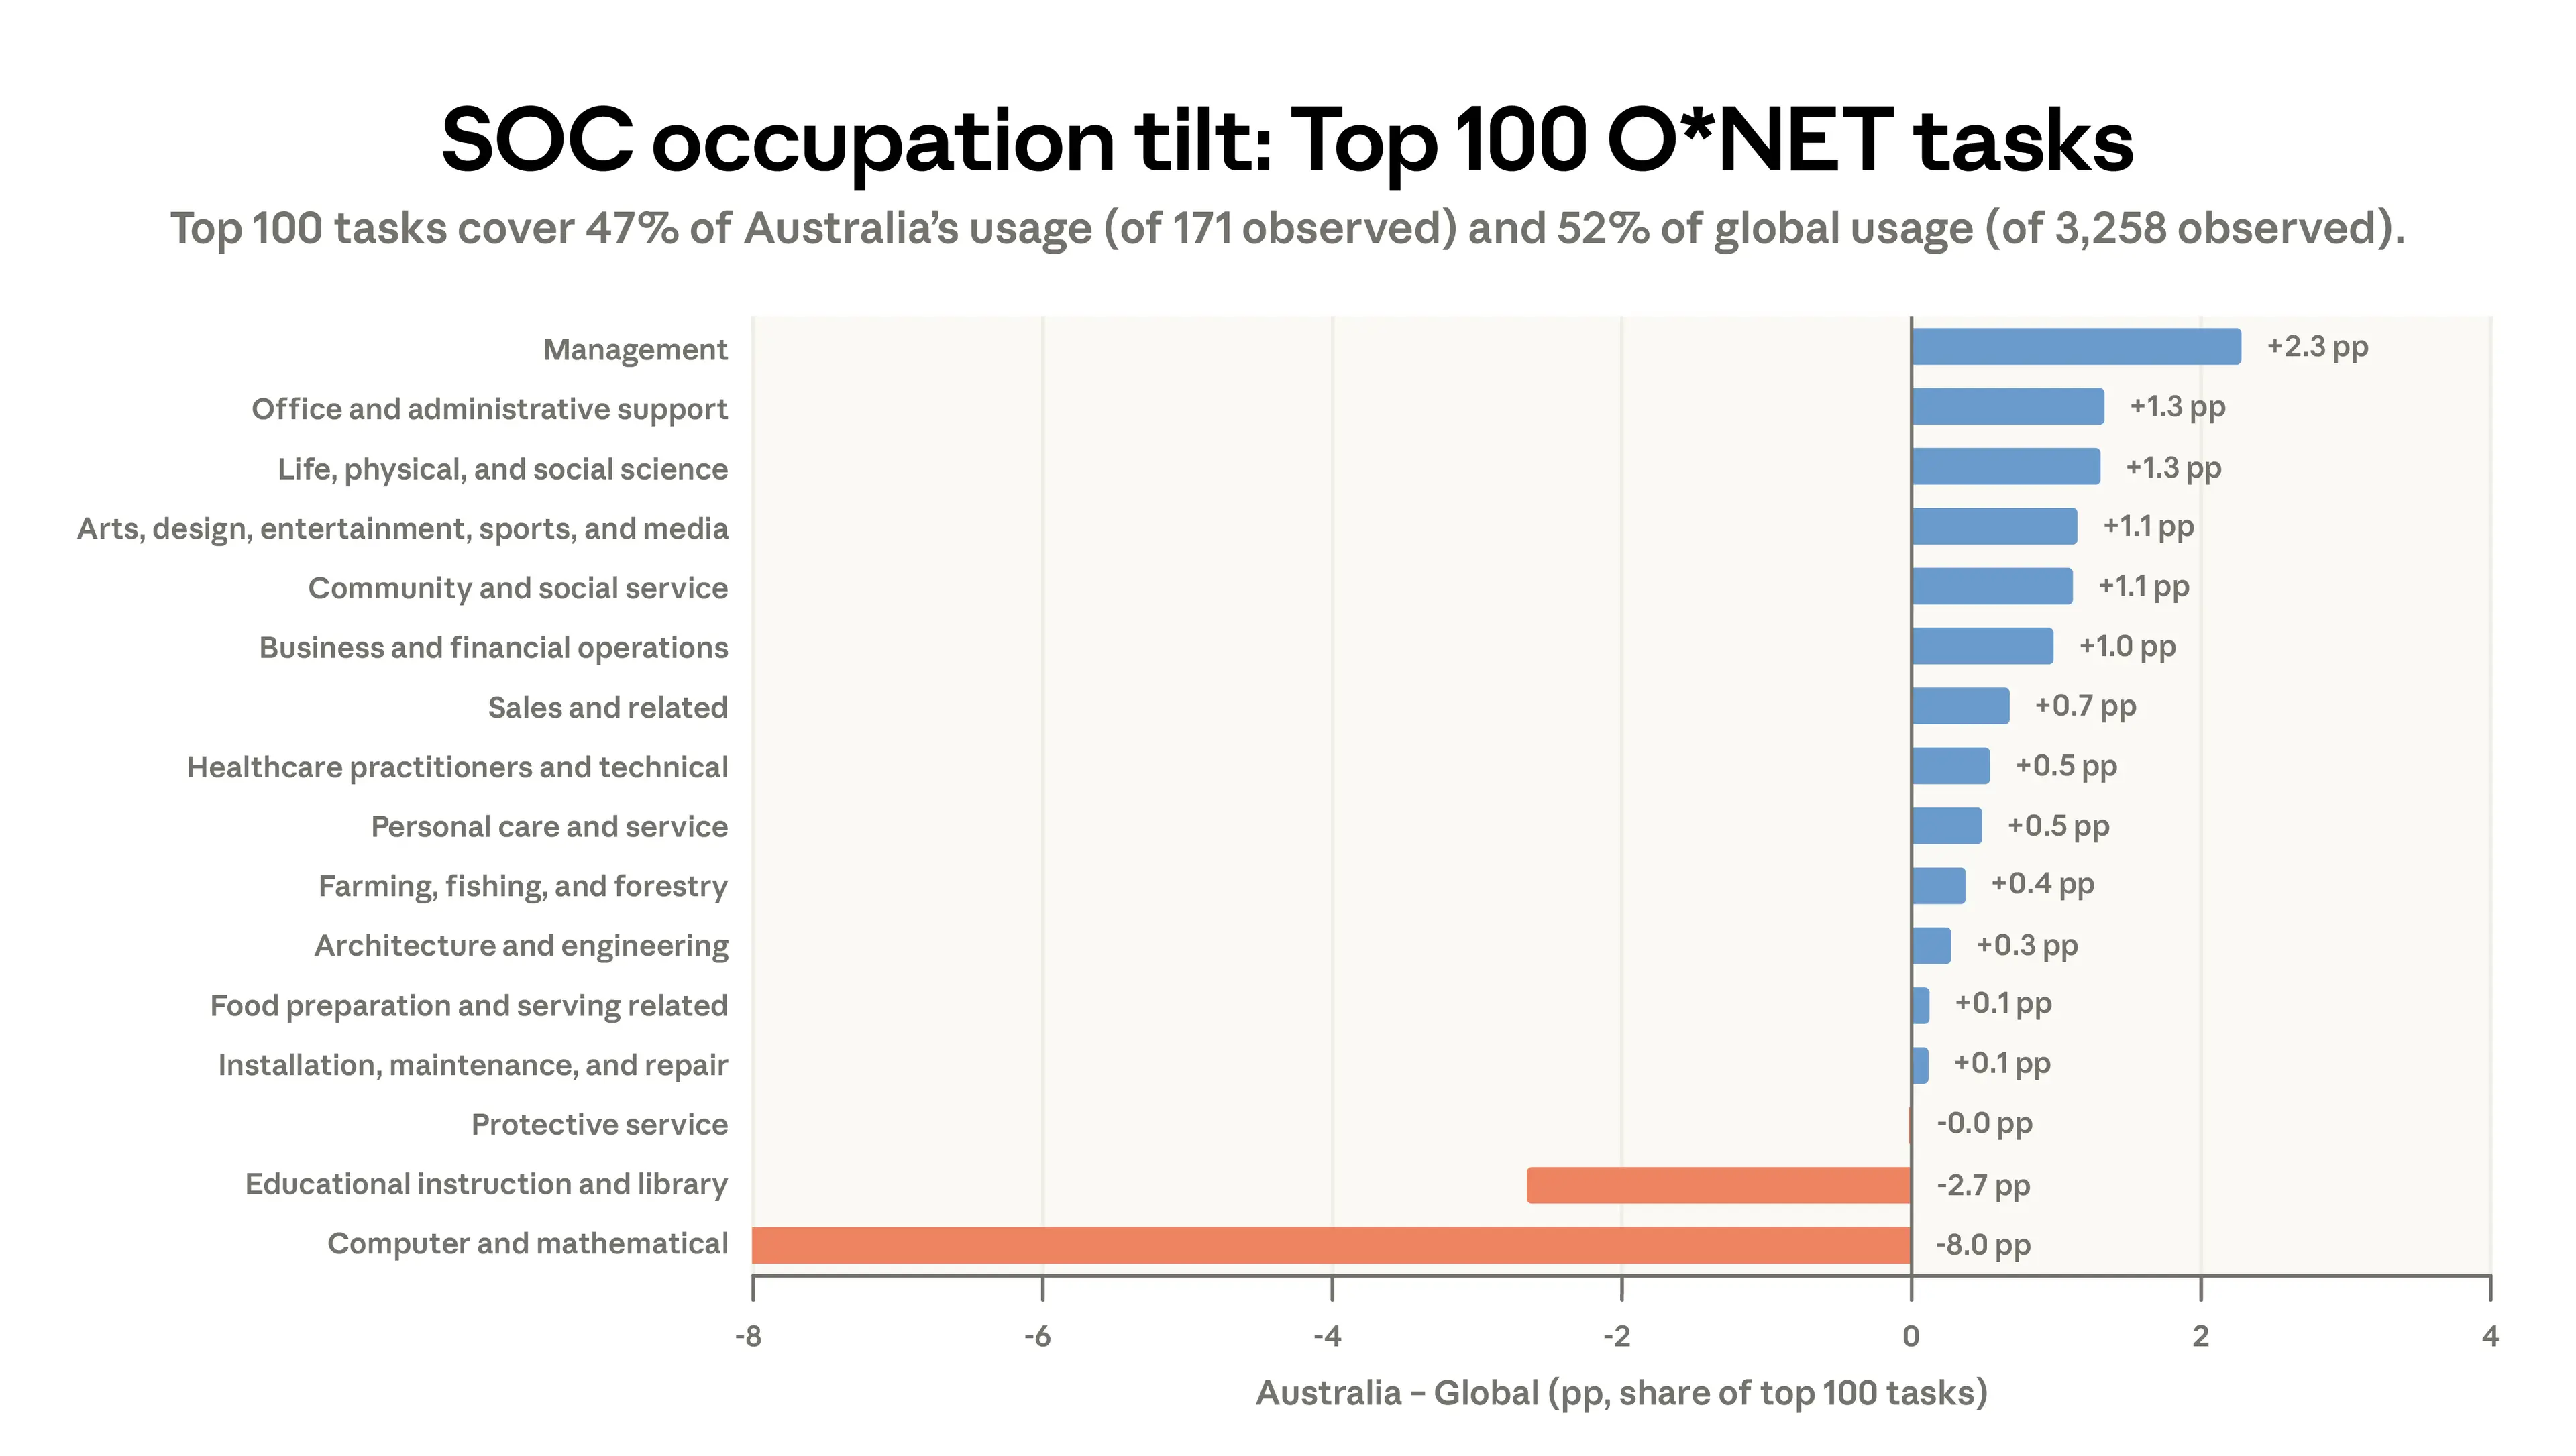
Bars show the difference (in percentage points) between each SOC group's share of Australia's top 100 O*NET tasks and that group's share of the global top 100. Positive values indicate overrepresentation in Australia. Top 100 tasks cover 47% of Australia's classified usage (171 distinct tasks observed) and 52% of global classified usage (3,258 distinct tasks observed). Source: Anthropic Economic Index, February 2026.
At the level of individual request clusters—categories of what users ask Claude to do—the pattern is similar (Figure 7). The cluster that is most underrepresented in Australia relative to the global distribution is general coding assistance, at 13.5% of Australian use compared to 16.8% globally. Document translation is also underrepresented, consistent with Australia being a predominantly English-speaking market. The most overrepresented clusters are a mix of personal use (such as personal life management (+1.9pp) and health and well-being support (+1.8pp)), and non-technical professional work, including workplace correspondence (+1.7pp), business documents (+1.6pp), and financial guidance (+1.3pp).
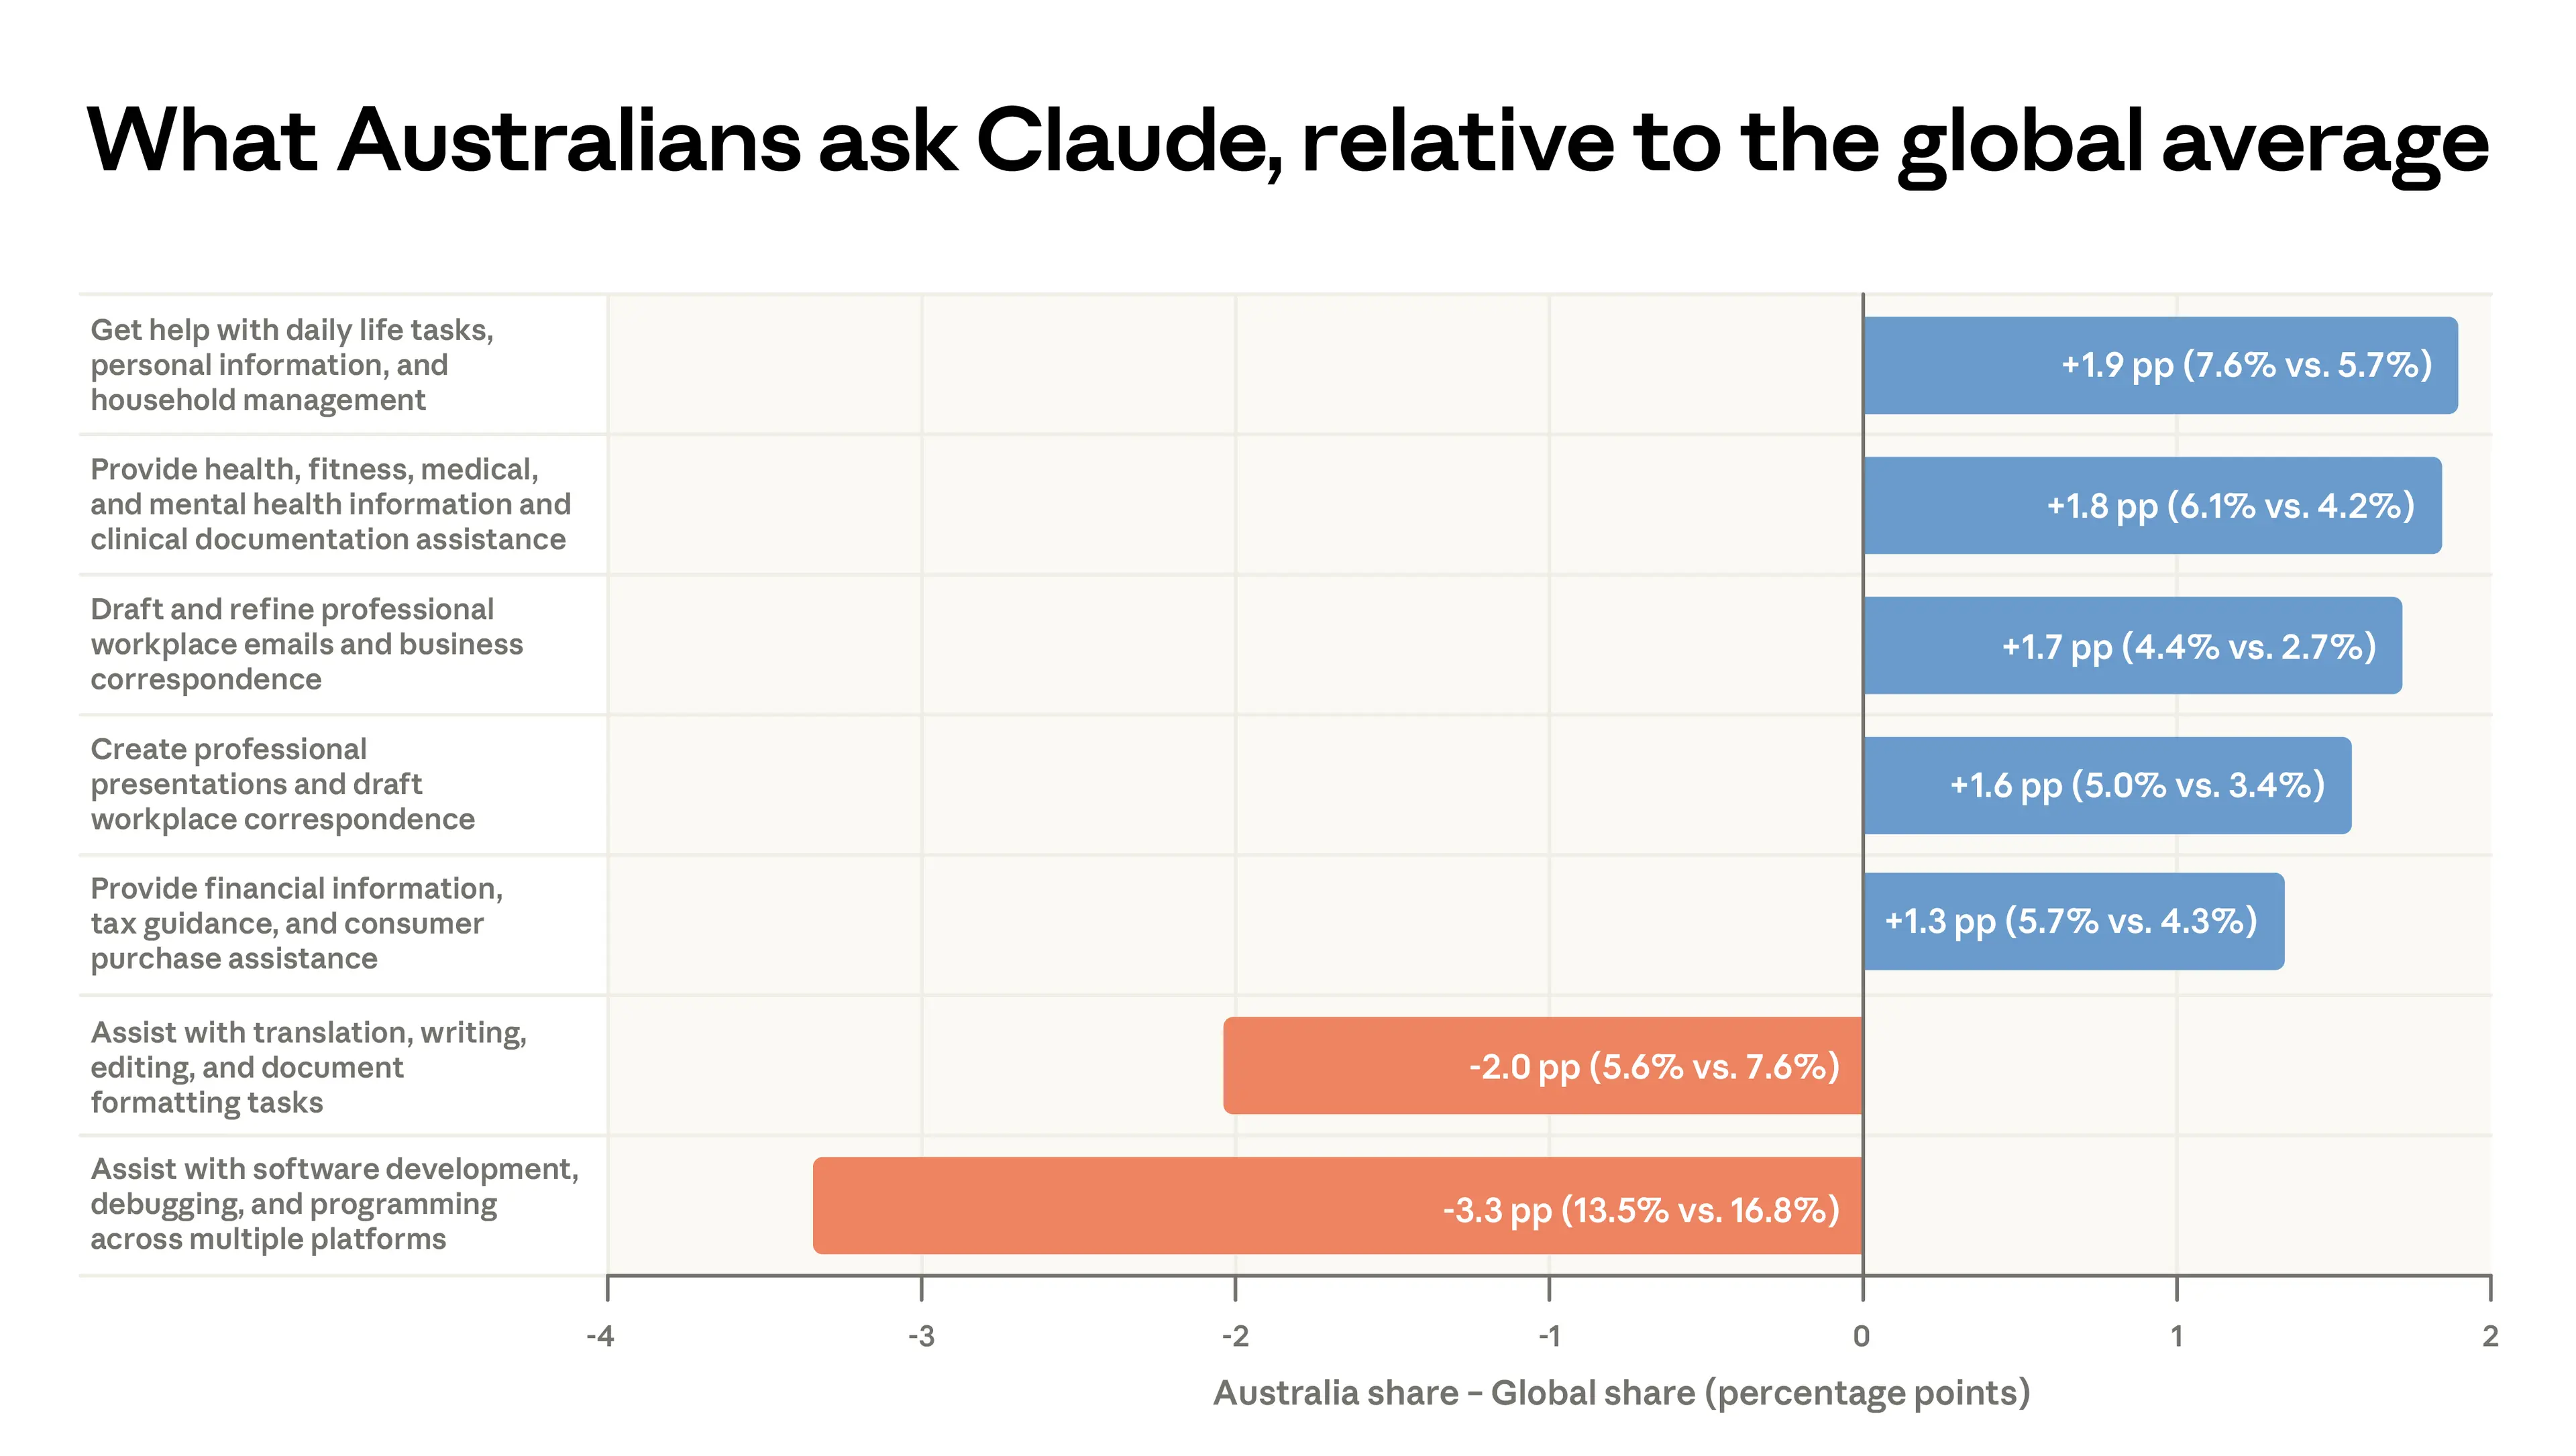
Bars show the difference (in percentage points) between each cluster's share of Australian Claude.ai conversations and its share of global conversations. Values in parentheses show the Australian and global shares respectively. Source: Anthropic Economic Index, February 2026.
Higher-adoption countries generally use Claude more broadly, so part of Australia's lower coding share is expected. Australia's Computer and Mathematical shortfall of 8.0pp sits right in line with the Anglosphere average of 8.9pp. Where Australia diverges from its peers is in what fills the gap: it leans further into Management (+2.3pp vs the Anglosphere's +1.2pp) and Office and Administrative Support (+1.3pp vs +0.1pp), rather than Educational Instruction (−2.7pp vs +1.6pp for peers).
Conclusion
Australia is among the leading per capita adopters of Claude, with usage more than four times what its working-age population would predict. The character of that usage—predominantly work and personal rather than coursework, sophisticated prompts addressing relatively short tasks, and with less delegation to Claude—closely tracks other Anglosphere economies and cross-country relationships evident within the Anthropic Economic Index.
Where Australia is more distinctive is in the breadth of what Claude is used for. Australian usage is more diverse than the global aggregate, almost entirely because of a lower share of coding-related work; offsetting gains are spread across office, sales, management, and personal life categories rather than concentrated in any one category. As with other high adoption countries, users in Australia tend to collaborate more with Claude and delegate decision-making less often.
Within Australia, adoption is concentrated in New South Wales and Victoria, and the state-level variation tracks workforce composition rather than income per capita—consistent with the pattern across US states but in contrast to the income gradient across countries.
Citation
@online{mccrory2026australiacountrybrief,
author = {Peter McCrory},
title = {How Australia Uses Claude: Findings from the Anthropic Economic Index},
date = {2026-03-31},
year = {2026},
url = {https://www.anthropic.com/research/australia-brief-economic-index-march-2026},
}
Acknowledgements
Keir Bradwell, Ria Strasser Galvis, Ryan Heller, Eva Lyubich, Jennifer Marintez, Maxim Massenkoff, Jared Mueller, Sarah Pollack
Related content
Anthropic Economic Index report: Cadences
In our latest Economic Index report, we sample hourly for the first time to ask: When do people come to Claude? What do they produce with it? And how do they perceive AI's impact on their work?
Read moreProject Fetch: Phase two
We report results from our latest test of whether Claude can help Anthropic employees perform sophisticated robotics tasks. We found that Claude Opus 4.7, operating without human assistance, was about 20 times faster than the fastest human team at all tasks completed by participants less than a year ago.
Read moreAgentic coding and persistent returns to expertise
This report provides evidence on how Claude Code is used in practice, based on a privacy-preserving analysis of around 400,000 interactive sessions from around 235,000 people between October 2025 and April 2026.
Read more