
The Anthropic Economic Index uses our privacy-preserving data analysis system to track how Claude is being used across the economy. It’s part of our effort to understand the economic impacts of AI as early as possible, so that researchers and policymakers have adequate time to prepare.
This latest report studies Claude usage in February 2026, building on the economic primitives framework introduced in our previous report (which used data from November 2025). Our sample covers February 5 to February 12, three months following the release of Claude Opus 4.5 and coincident with the release of Claude Opus 4.6.
We first document how usage has changed relative to our previous reports: the rate of augmentation, collaborative interaction where the AI complements the user’s abilities, increased slightly in both Claude.ai and API traffic. In Claude.ai, usage diversified, with the top 10 tasks accounting for a smaller share of usage last month than in November 2025. As a result of this diversification, the average conversation in Claude.ai had a slightly lower-wage task than in previous reports.
We then focus on an important determinant of Claude’s impact on the labor market and the broader economy: learning curves in Claude adoption. We present evidence that high-tenure users have developed habits and strategies that allow them to better harness Claude’s capabilities. Indeed, we document that more experienced users not only attempt higher-value tasks, but are also more likely to elicit successful responses in their conversations.
What has changed since our last report
In the first chapter, we revisit findings from our previous Economic Index report, published in January 2026. We find that:
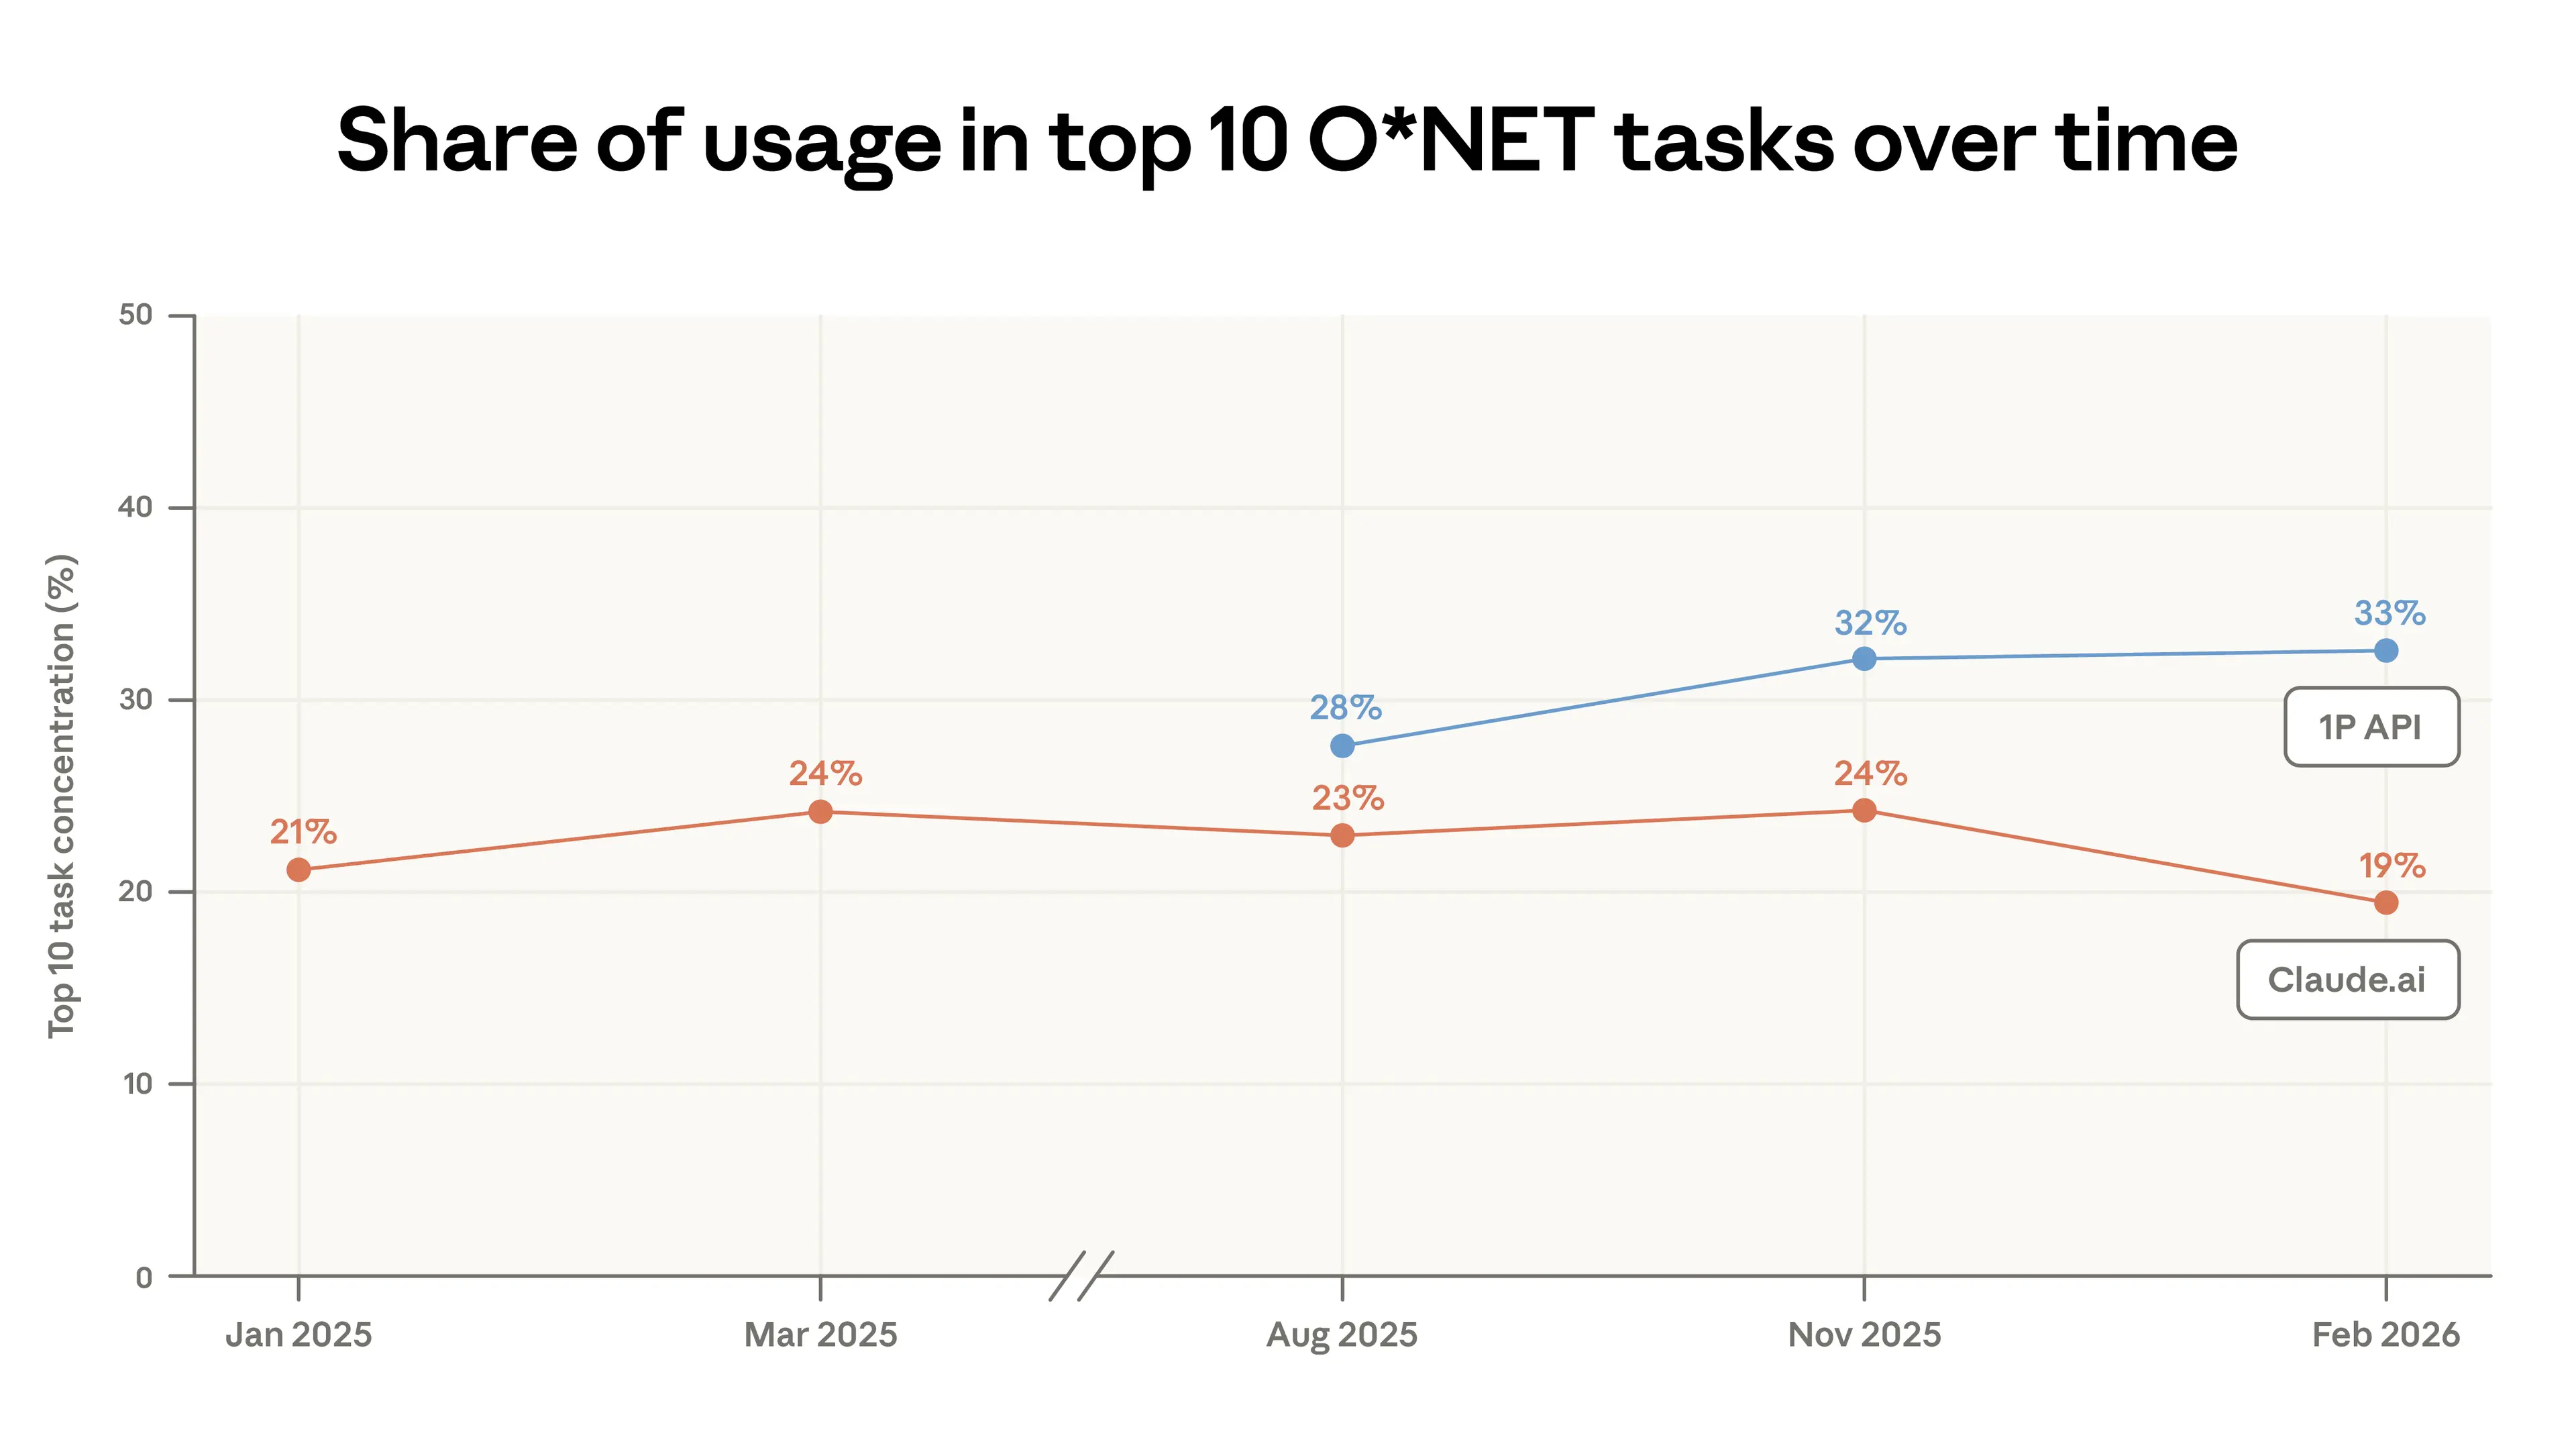
- Use cases on Claude.ai diversified. Coding tasks continue to migrate from augmentative usage in Claude.ai to more automated workflows in our first-party API traffic.1 In this report, Claude.ai usage was less concentrated: the top 10 tasks made up 19% of all traffic in February, down from 24% in November. That said, almost all tasks in this sample appeared in at least one of our previous samples. About 49% of jobs have seen at least a quarter of their tasks performed using Claude.
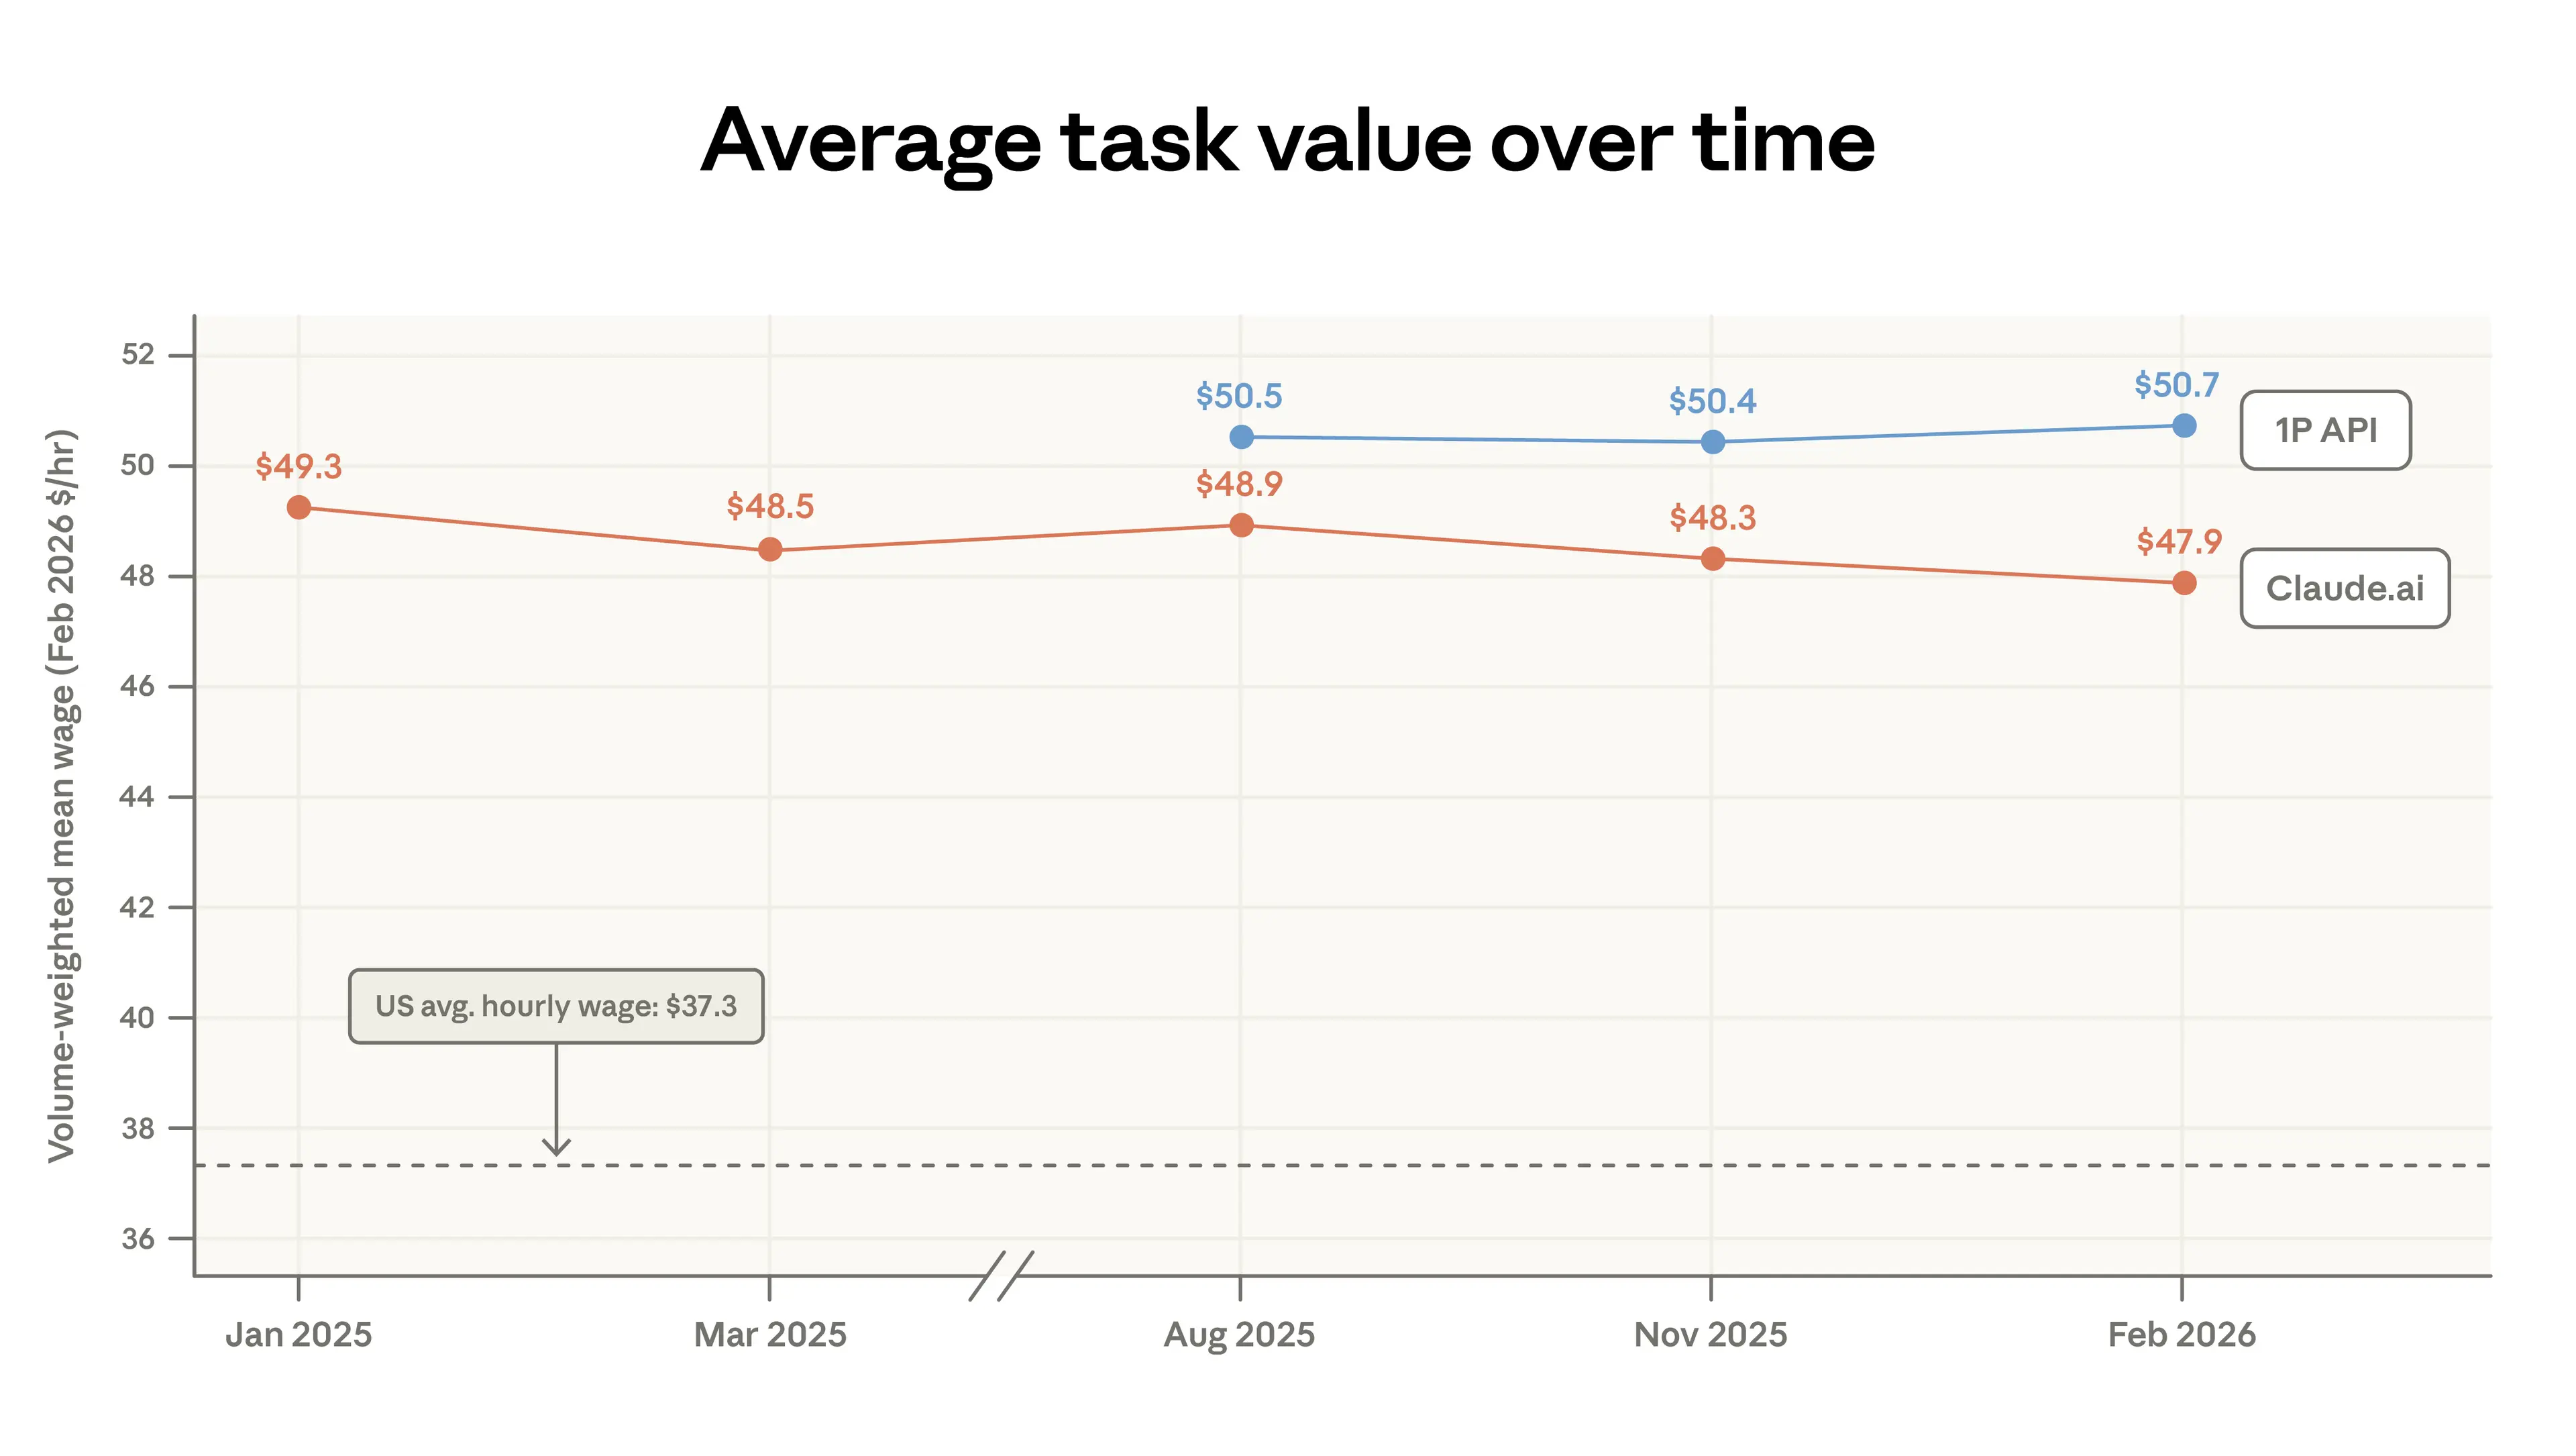
- Claude adoption broadened to lower-wage tasks. As use cases have diversified, the average economic value of work done on Claude—as measured by US wages paid to workers in the associated occupations—has decreased slightly. This is caused, mechanically, by a rise in personal queries around sports, product comparisons, and home maintenance. The pattern is consistent with a standard “adoption curve” story, in which early-adopters favor specific high-value uses like coding, and later adopters take on a much wider range of tasks.
- Inequality in global usage has persisted. Usage remains heavily concentrated: the top 20 countries account for 48% of all per-capita usage, up from 45%, underscoring a persistent gap in global adoption. However, Claude usage per capita continued to converge within the United States: the share of usage accounted for by the 10 highest usage states decreased from 40% to 38% since our last report.
Learning curves
A central finding in the Economic Index is that early adoption of Claude is very uneven: Claude is used more intensely in high-income countries, within the US in places with more knowledge workers, and for a relatively small set of specialized tasks and occupations.
An important question is how inequality of adoption might determine where and to whom the benefits of AI will accrue. If, for example, effective AI use requires complementary skills and expertise—which we argued in our previous report—and if such skills can be acquired through use and experimentation, then the benefits from early adoption may be self-reinforcing.
In our second chapter we investigate how users appear to shape the value that they get out of Claude: how they match model capability to the task at hand, and how usage patterns and outcomes shift with experience on the platform.
- Model selection matches the task. We show that users choose our most intelligent model class, Opus, for tasks that normally receive higher wages in the labor market. For example, among paying Claude.ai users, Opus is used 4 percentage points more than average for coding tasks and 7 percentage points less than average for tutoring-related tasks. This model switching is about twice as stark for API users.
- Higher tenure, higher success. In general, the most seasoned Claude users employ it more often for higher-education tasks and less often for personal use cases. For example, people who have been using Claude for 6 months or more have 10% fewer personal conversations and a 6% higher education level reflected in their inputs. Most strikingly, people in this higher-tenure group have a 10% higher success rate in their conversations, an association that is not explained by their task selection, country of origin, or other factors. While this could reflect sophistication of early adopters, it could also be evidence of learning-by-doing, where people get better at using Claude through experience.
What has changed since our last report
Diversification of use cases in Claude.ai
We first look at the kinds of tasks that Claude is asked to perform. We use our privacy-preserving system, which allows us to describe behavior at an aggregated level without revealing the content of individual transcripts. We sample 1 million conversations from both Claude.ai, our consumer-facing web product, and our first-party API, the developer-facing interface for integrating Claude into products and workflows.2
Coding remains the most common use on our platforms, with tasks associated with Computer and Mathematical occupations accounting for 35% of conversations on Claude.ai (see Appendix).3 However, between November 2025 and February 2026, use cases on Claude.ai became less concentrated: the top 10 most common O*NET tasks went from 24% of conversations to just 19% (Figure 1.1).
This decline in concentration partly reflects coding tasks migrating from Claude.ai to our first-party API, where Claude Code has grown to represent a large share of sampled traffic. Claude Code’s agentic architecture splits coding work into smaller API calls, which are labeled as distinct tasks. So while coding’s overall share of API traffic has grown, it is spread across many task categories rather than concentrated in a few. As a result, task concentration in the API remained roughly flat despite the influx of coding activity.
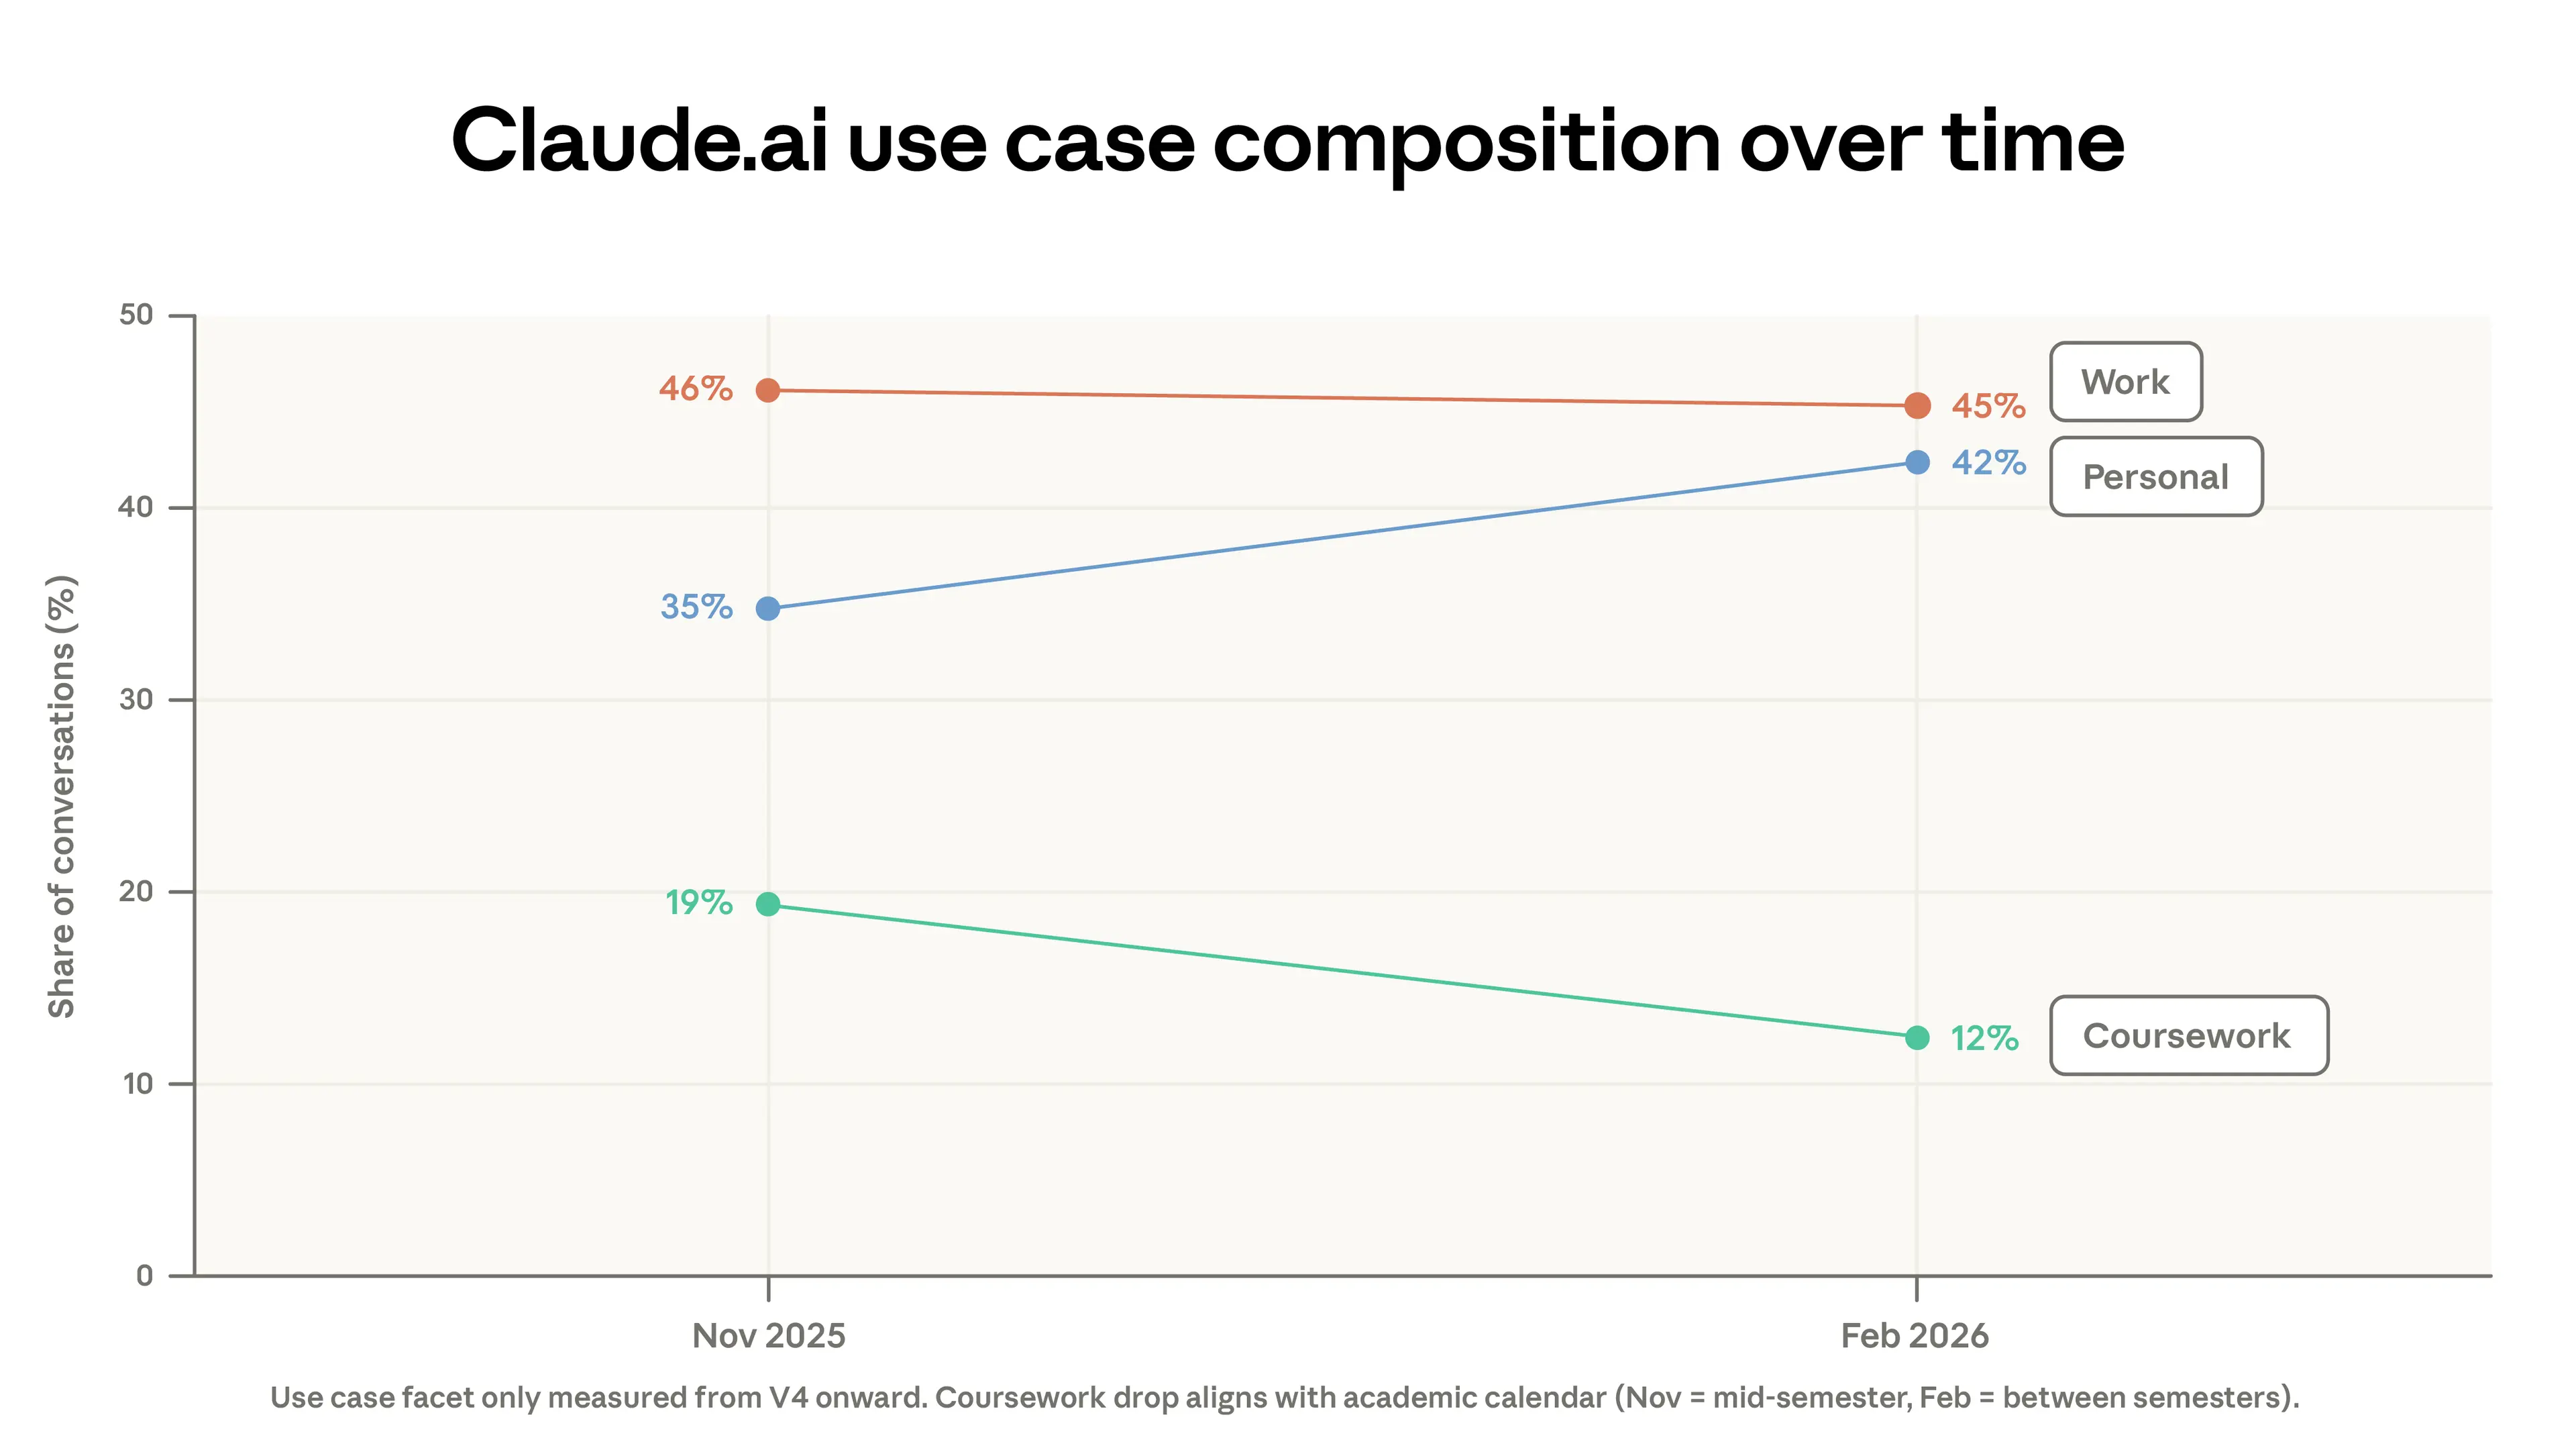
This migration of code out of Claude.ai is not the only factor driving decreased concentration. Part of the drop is due to changes in the mix of use cases between the two periods. Coursework fell from 19% to 12% of conversations, while personal use rose from 35% to 42% of conversations. Some of the drop in coursework can be explained by academic calendars in countries where students were on winter break during our sample period.4 At the same time, increasing signups beginning around February brought more casual AI users.
While the spread of Claude's work tasks became more diverse, almost all of these had been seen before in our data. In our previous report, we noted that 49% of jobs had seen at least a quarter of their tasks performed using Claude. In this data pull, that cumulative estimate barely changed (Appendix Figure A.2). Our data from this report showed many fewer novel O*NET tasks than in our previous report.
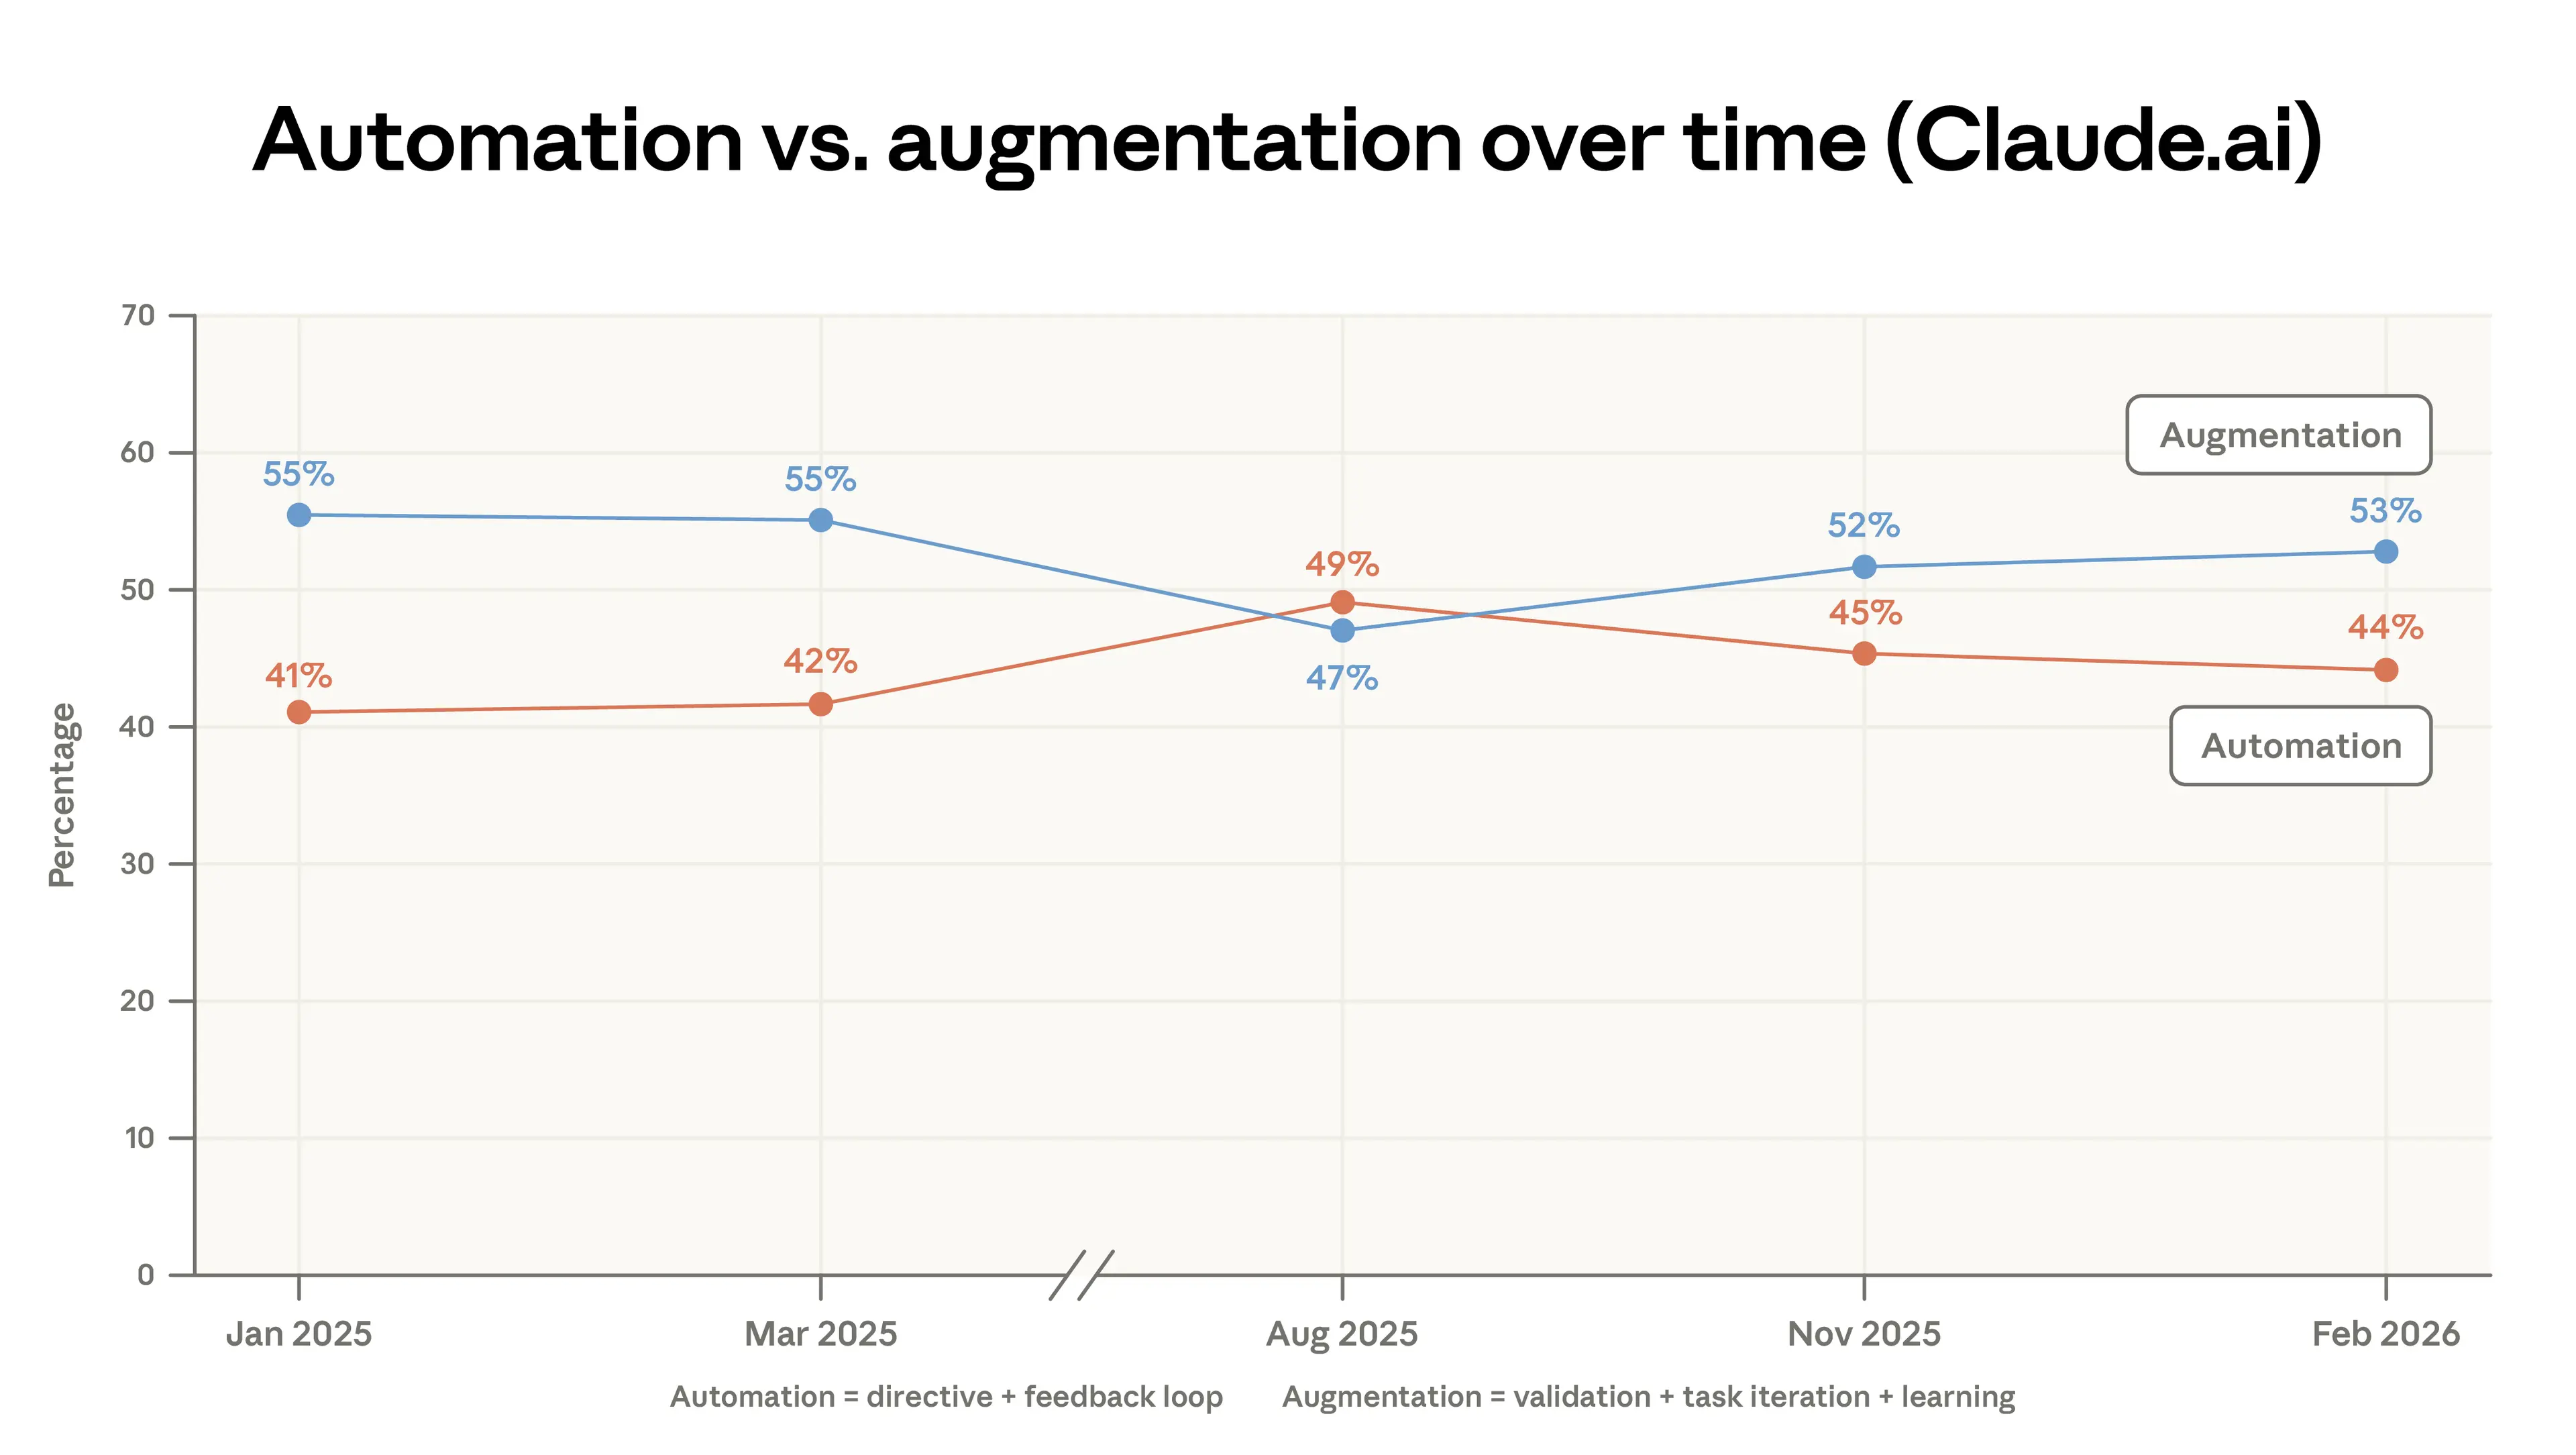
Since our first report, we have classified conversations into one of five interaction types—directive, feedback loop, task iteration, validation, and learning—which we group into two broader categories: automation and augmentation.5 Figure 1.3 shows that augmentation in Claude.ai increased slightly. This was driven by small bumps in validation and learning patterns. In Appendix Figure A.3, we show that automation decreased sharply in the 1P API data.
Our API platform continued to gain a relatively higher share of Computer and Mathematical tasks (usage shares by job categories are shown in the Appendix). Since August 2025, the share of tasks in this category has increased by 14% in the API and decreased by 18% in Claude.ai. As we note in our report on labor market impacts, we expect that this migration from Claude.ai to the API may signal more imminent transformation of work for the associated jobs. The increase in tasks associated with Management occupations in Claude.ai, which went from 3 to 5% of its traffic, comes from a mix of both analytical tasks (e.g., preparing an investment memo) and responding to customer questions.
Another way to measure the change in the mix of tasks done on Claude is to look at the change in the average value of tasks, which we define as the average hourly wage of US workers who perform that task (Figure 1.4).6 This estimate of the value of tasks in Claude.ai has dropped slightly from $49.3 to $47.9 mostly due to an increase in simple factual questions (e.g., sports outcomes, weather) and a decrease in coding as it shifts to the API. As mentioned in our previous report, the tasks we see on Claude tend to require higher education. The plot shows that these tasks also tend to earn higher wages than the US national average.
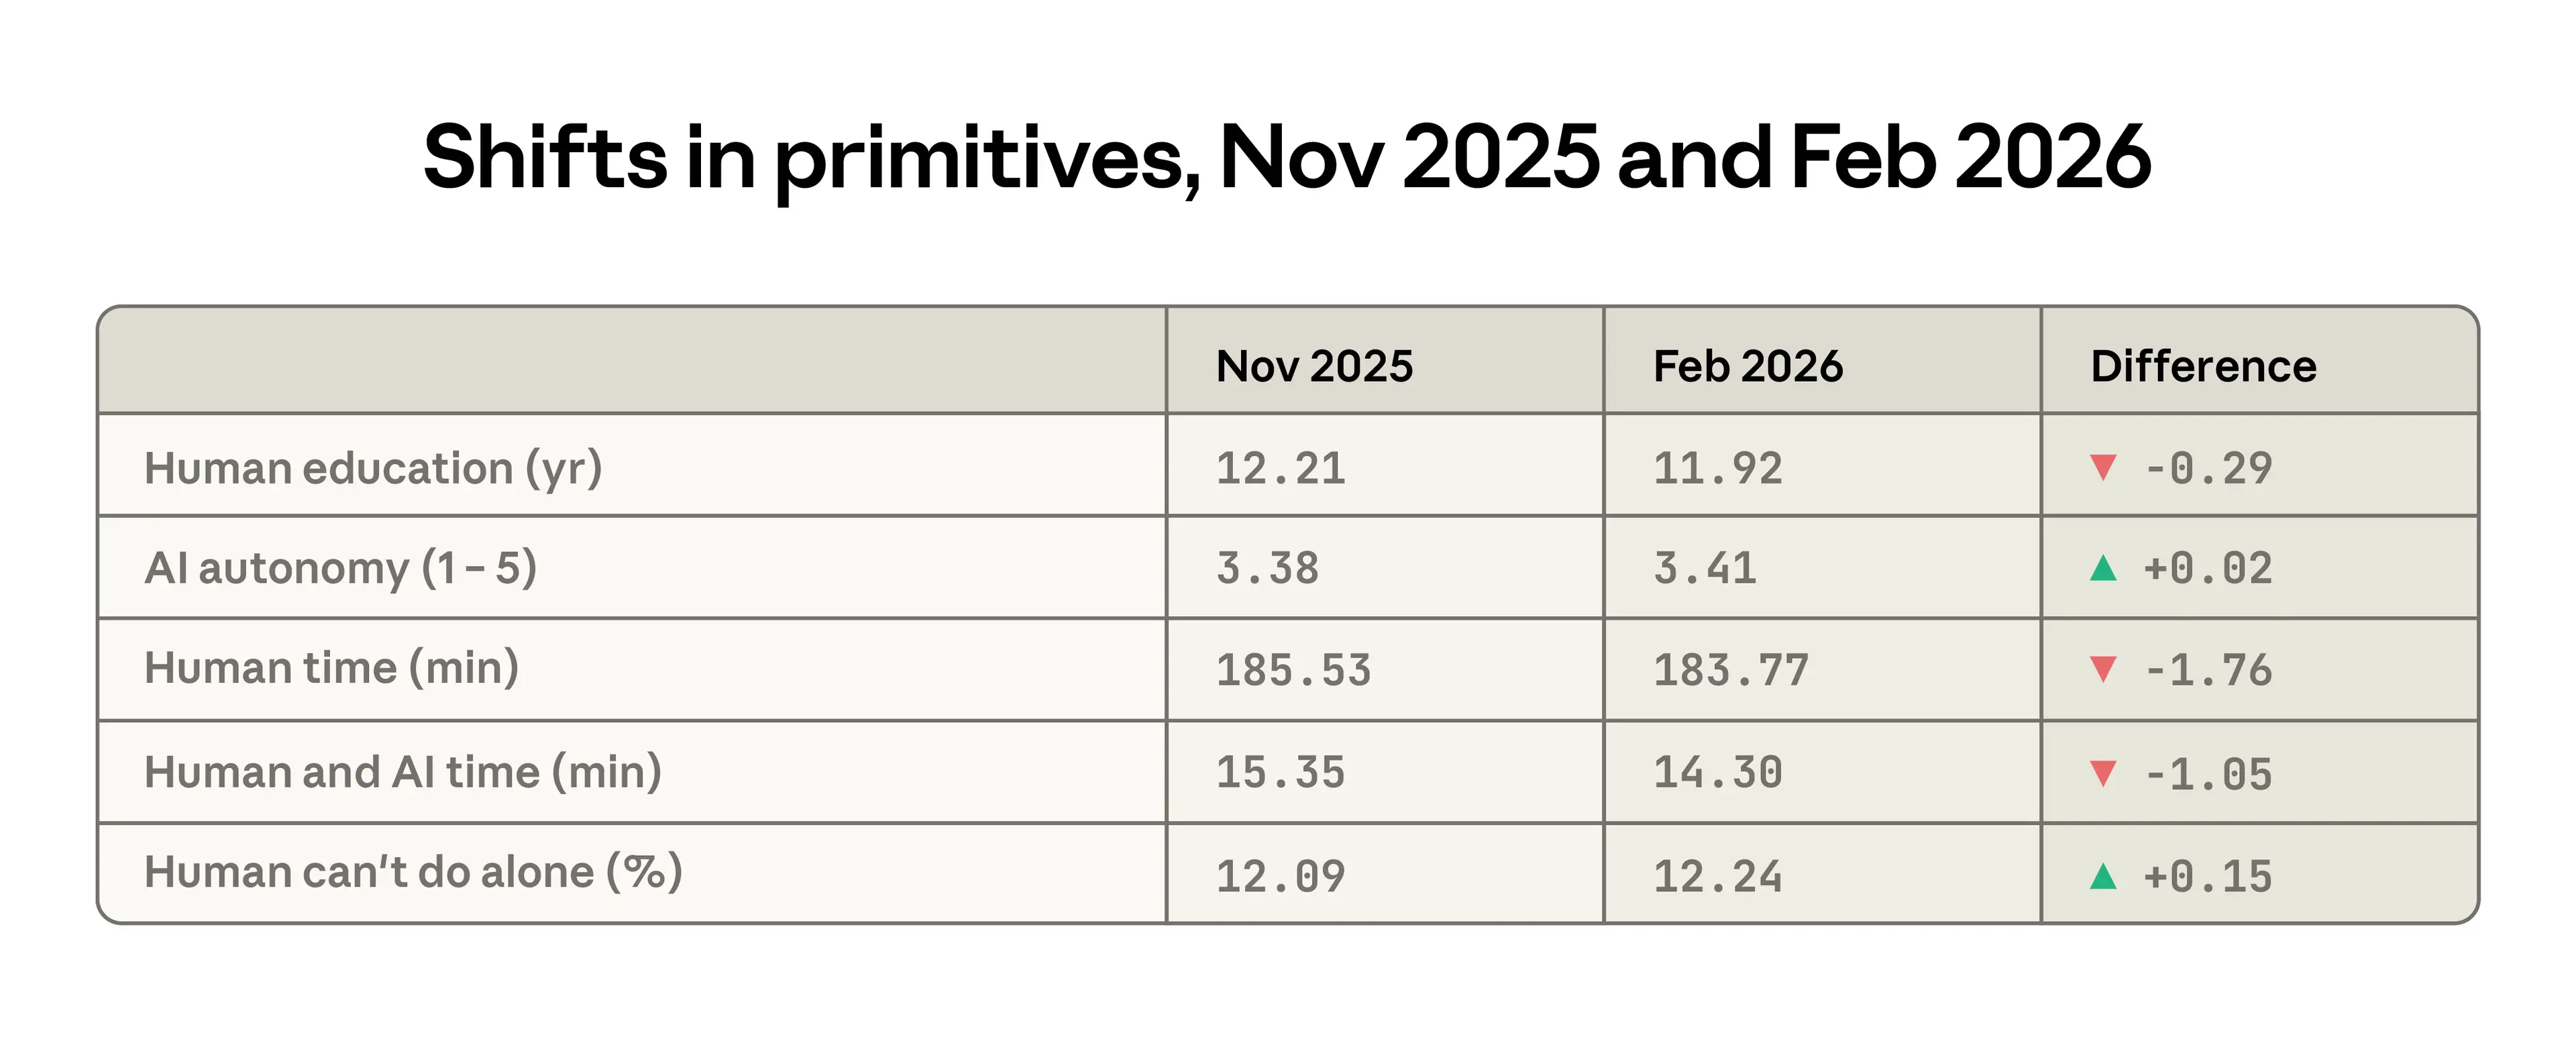
While slight, changes in several primitives between the previous and current report capture similar declines in task complexity on Claude.ai. The average years of education required for the human inputs declined from 12.2 to 11.9 years, users granted more autonomy to the AI, and the time required for the human to do the task alone fell by about 2 minutes. One change goes ostensibly in the opposite direction: the tasks performed by Claude were judged to be slightly less possible for a human without access to AI.
Emergent automation patterns
As tasks migrate to the API, they may become more exposed to automation. API workflows are far more likely to be directive, with less need for a human in the loop. In a previous report, we highlighted that customer service tasks, including, for example, automated support for payment and billing issues, are prevalent in the API data. These contributed to a higher observed exposure for Customer Service Representatives—Claude was recorded doing a high share of their tasks in automated workflows, so these jobs may be more likely to change as AI diffuses.
We highlight two API workflows that appeared more frequently in February as compared to three months prior, with their shares at least doubling in our latest sample:7
- Business sales & outreach automation: sales enablement generation, B2B lead qualification research, customer data enrichment, cold-email drafting.
- Automated trading & market ops: monitor markets or positions, propose specific investments, inform traders of market conditions, and related tasks.
Revisiting geographic convergence
In our previous report, we noted that the Anthropic AI Usage Index (AUI), which adjusts usage by a geography’s working-age population, was converging rapidly across US states: states with initially lower usage per capita showed faster adoption.
The left panel of Figure 1.6 shows that this convergence continued in our most recent data, but at a slower pace. From August 2025 to February 2026, the share of per-person usage going to the top five states has decreased from 30 to 24%. The Gini coefficient has fallen since August 2025, though the pace of convergence has slowed. When we update our estimates from the previous report, we find that at this rate states would arrive at roughly equal usage per capita in 5–9 years, rather than 2–5.8
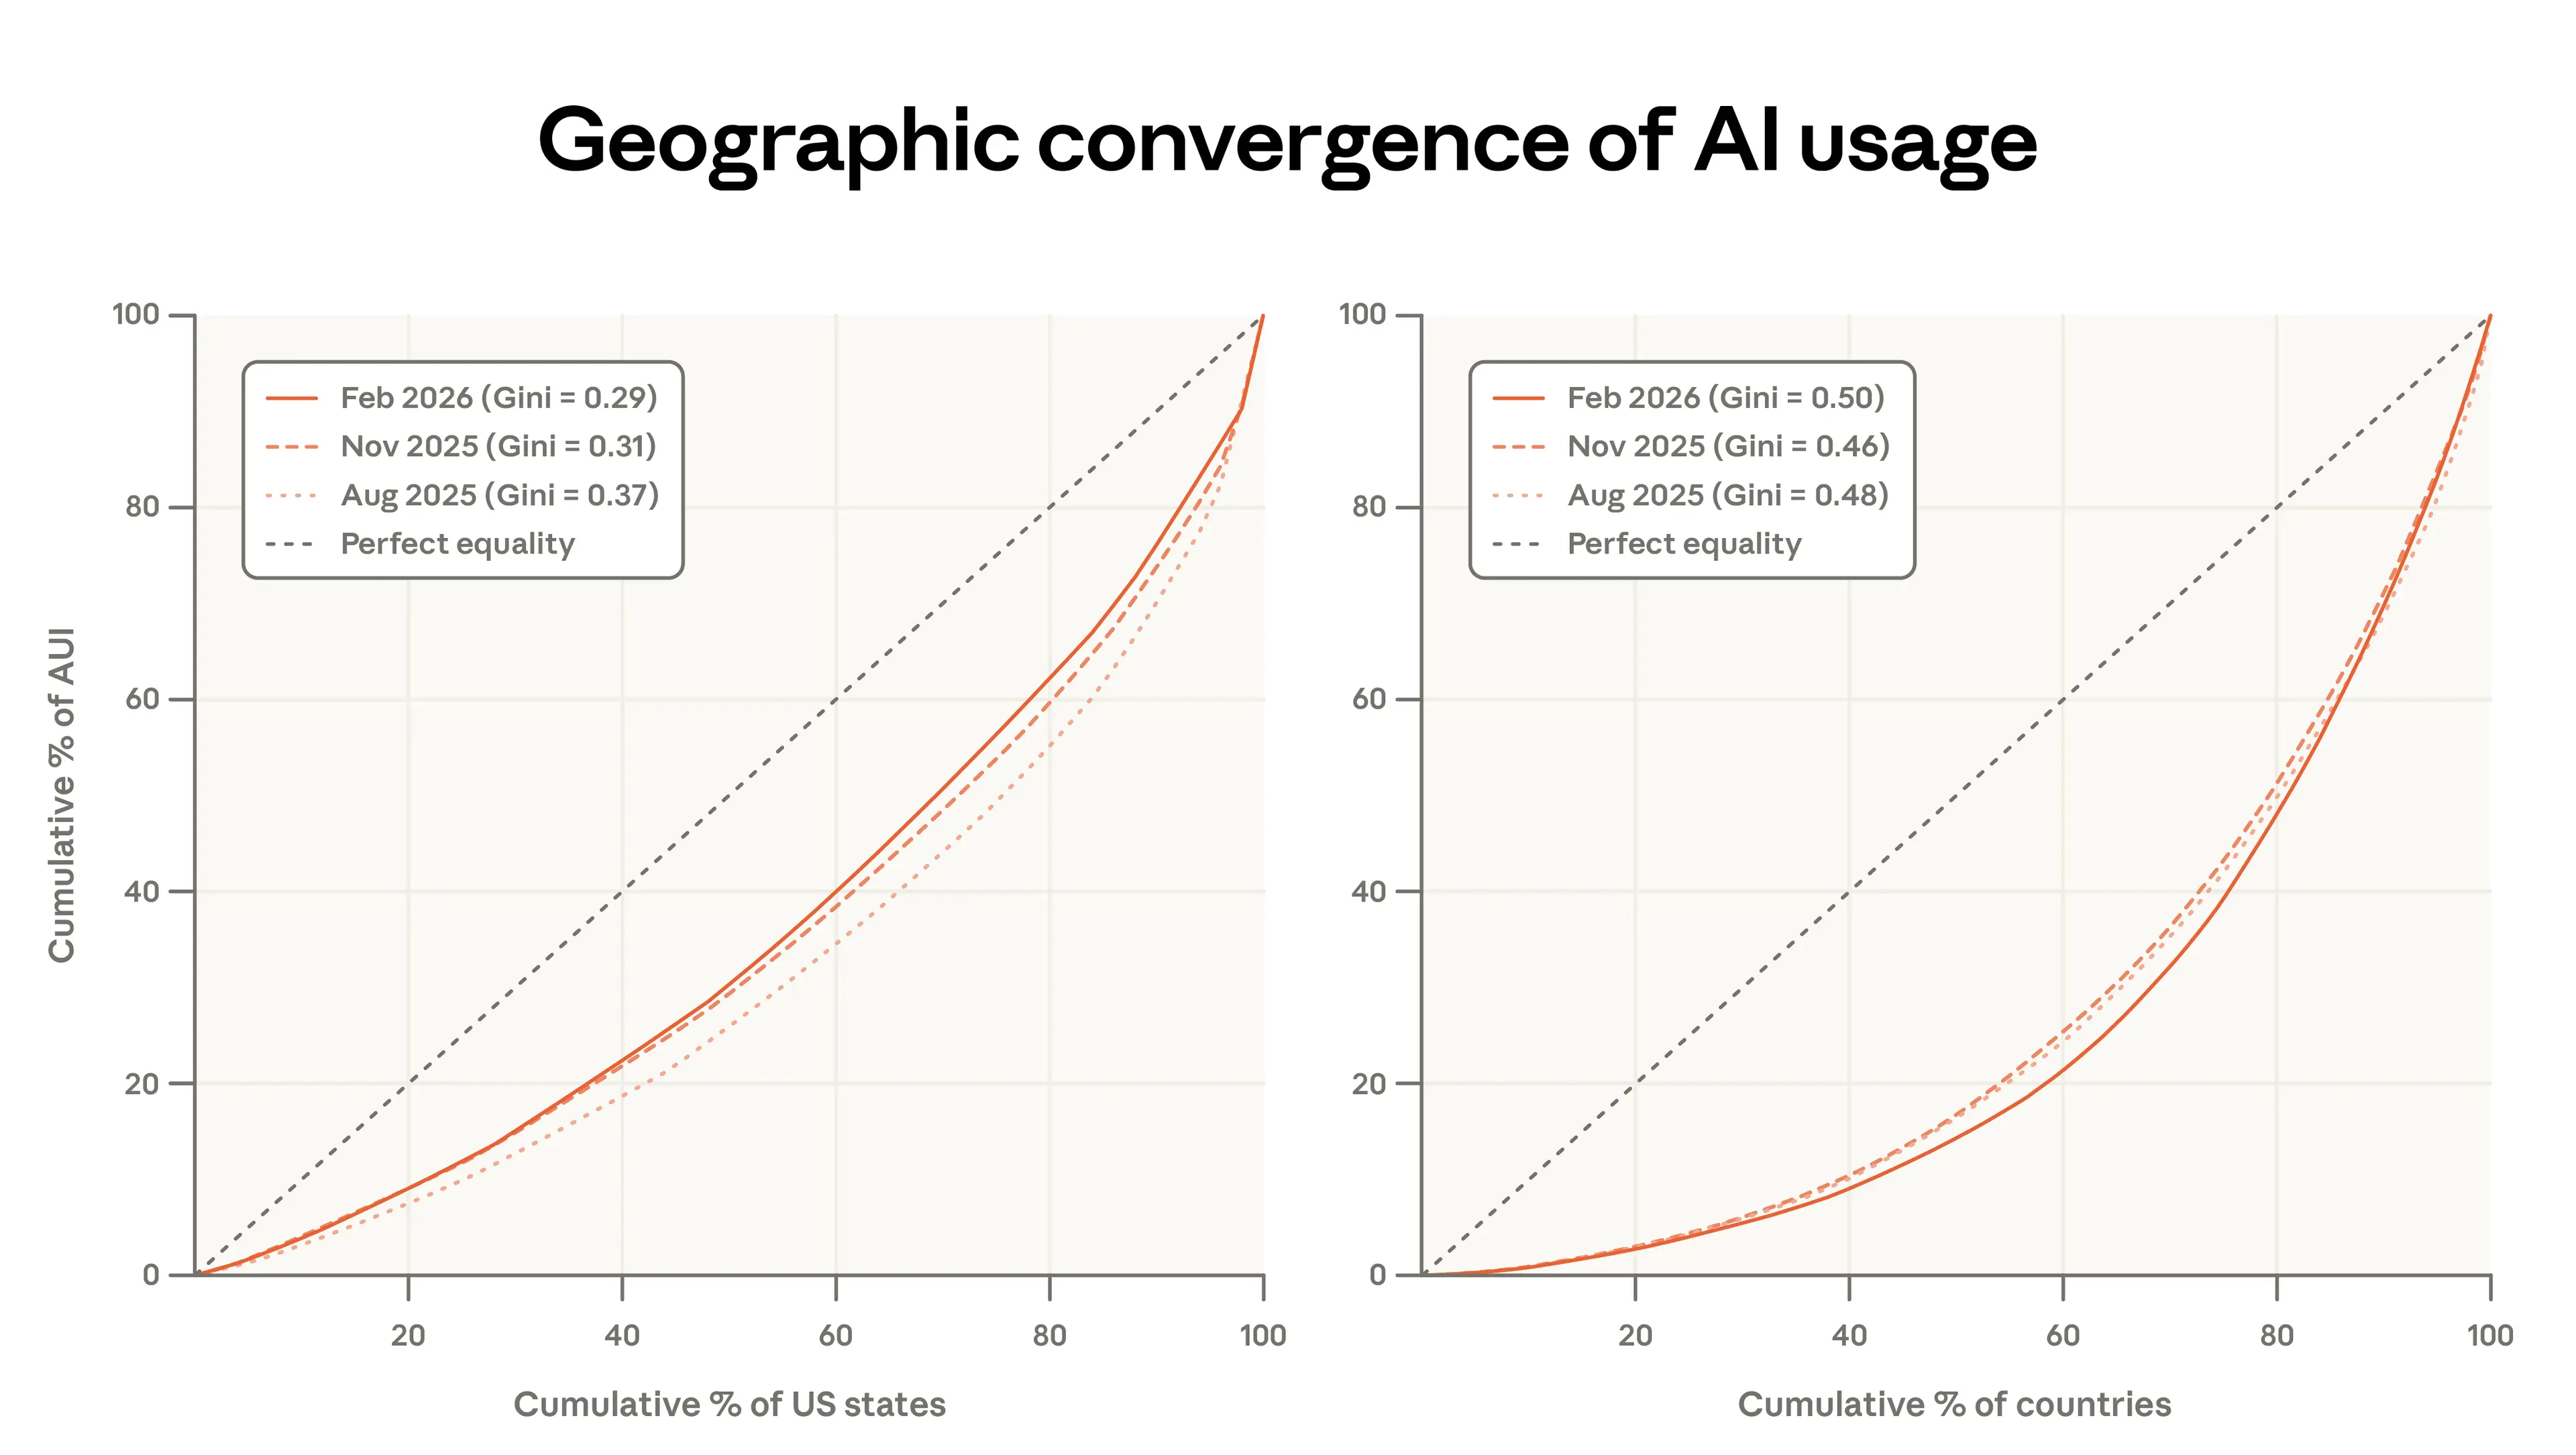
Across countries (right panel), the pattern is reversed: usage has become slightly more concentrated, with the Gini rising over the same period. The countries using Claude the most (per capita) now account for a larger share of overall usage, with the top 20 countries going from 45 to 48% of usage adjusted for population.
Learning to use AI
In this chapter, we focus on two features of usage that reflect how people deploy and learn to work with AI: model selection and the habits of longtime users.
First, we shed light on the demand for intelligence by studying when people choose Opus, our most performant model class. Little is known about how AI users choose between different models, navigating tradeoffs around speed, performance, and cost. If users are calibrating to the task at hand, we should see Opus concentrated on harder, higher-value work.
Next, we study how usage differs according to tenure, finding differences across users who signed up at different times. This sheds light on learning curves: do experienced users get better over time? How does their usage differ? We find evidence consistent with learning-by-doing. Not only do higher-tenure users have greater success in their conversations, they also collaborate with Claude more, bring more challenging tasks to Claude, and are more likely to use Claude for work purposes and for a wider range of tasks.
Model selection
The different Claude model classes (Haiku, Sonnet, and Opus) offer tradeoffs in terms of cost, speed, and performance. The Opus class of models uses the most tokens and excels at complex tasks, but at a higher per-token price on our API. If users are aware of this and mindful of costs and usage limits, they should bring their most complicated and valuable tasks to Opus, while selecting other models for simpler tasks. This is broadly what we observe in the data.
Figure 2.1 below shows that, for paid Claude.ai accounts, which have access to all model classes, 55% of Computer and Mathematical tasks (like coding software) use Opus, compared to 45% of Educational tasks. Technical users may notice performance gains and actively switch away from Sonnet, the default. Or efficiency-minded users may learn to use Sonnet for simpler tasks to avoid hitting usage limits. Relatedly, the differences here could reflect that most educational tasks are already fairly easy for Sonnet, or that students are more likely to be mindful of usage limits.
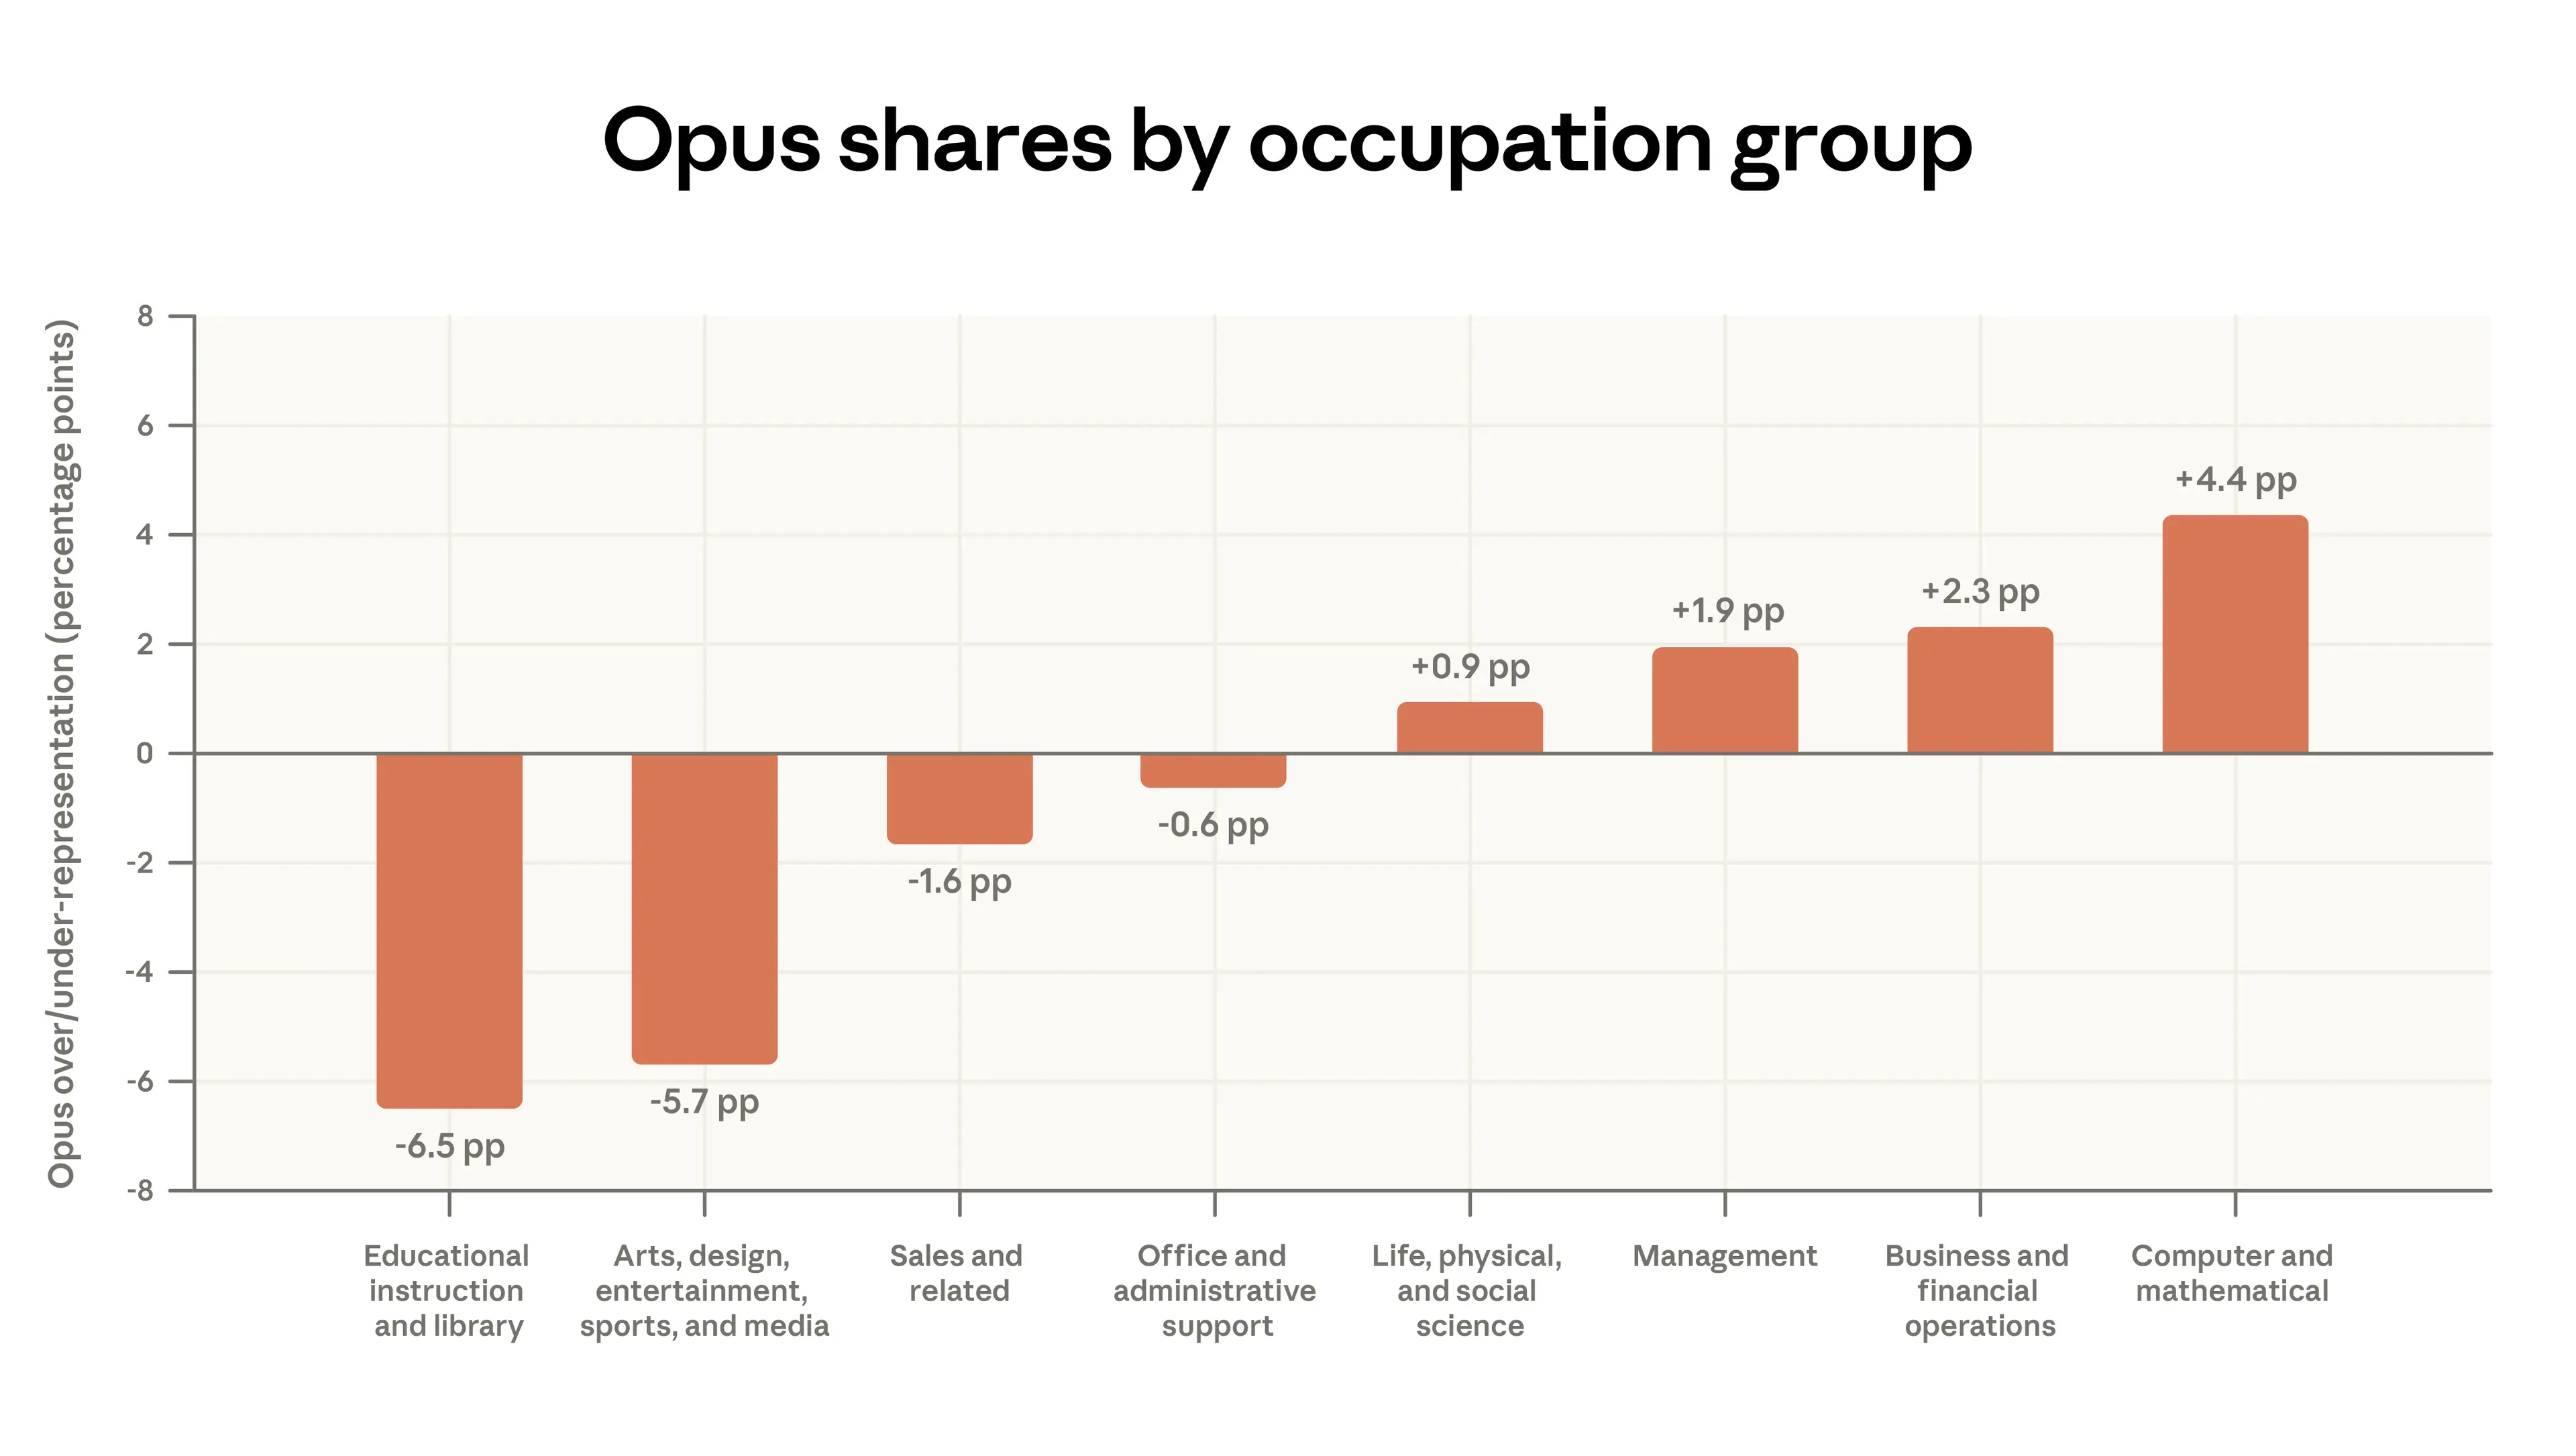
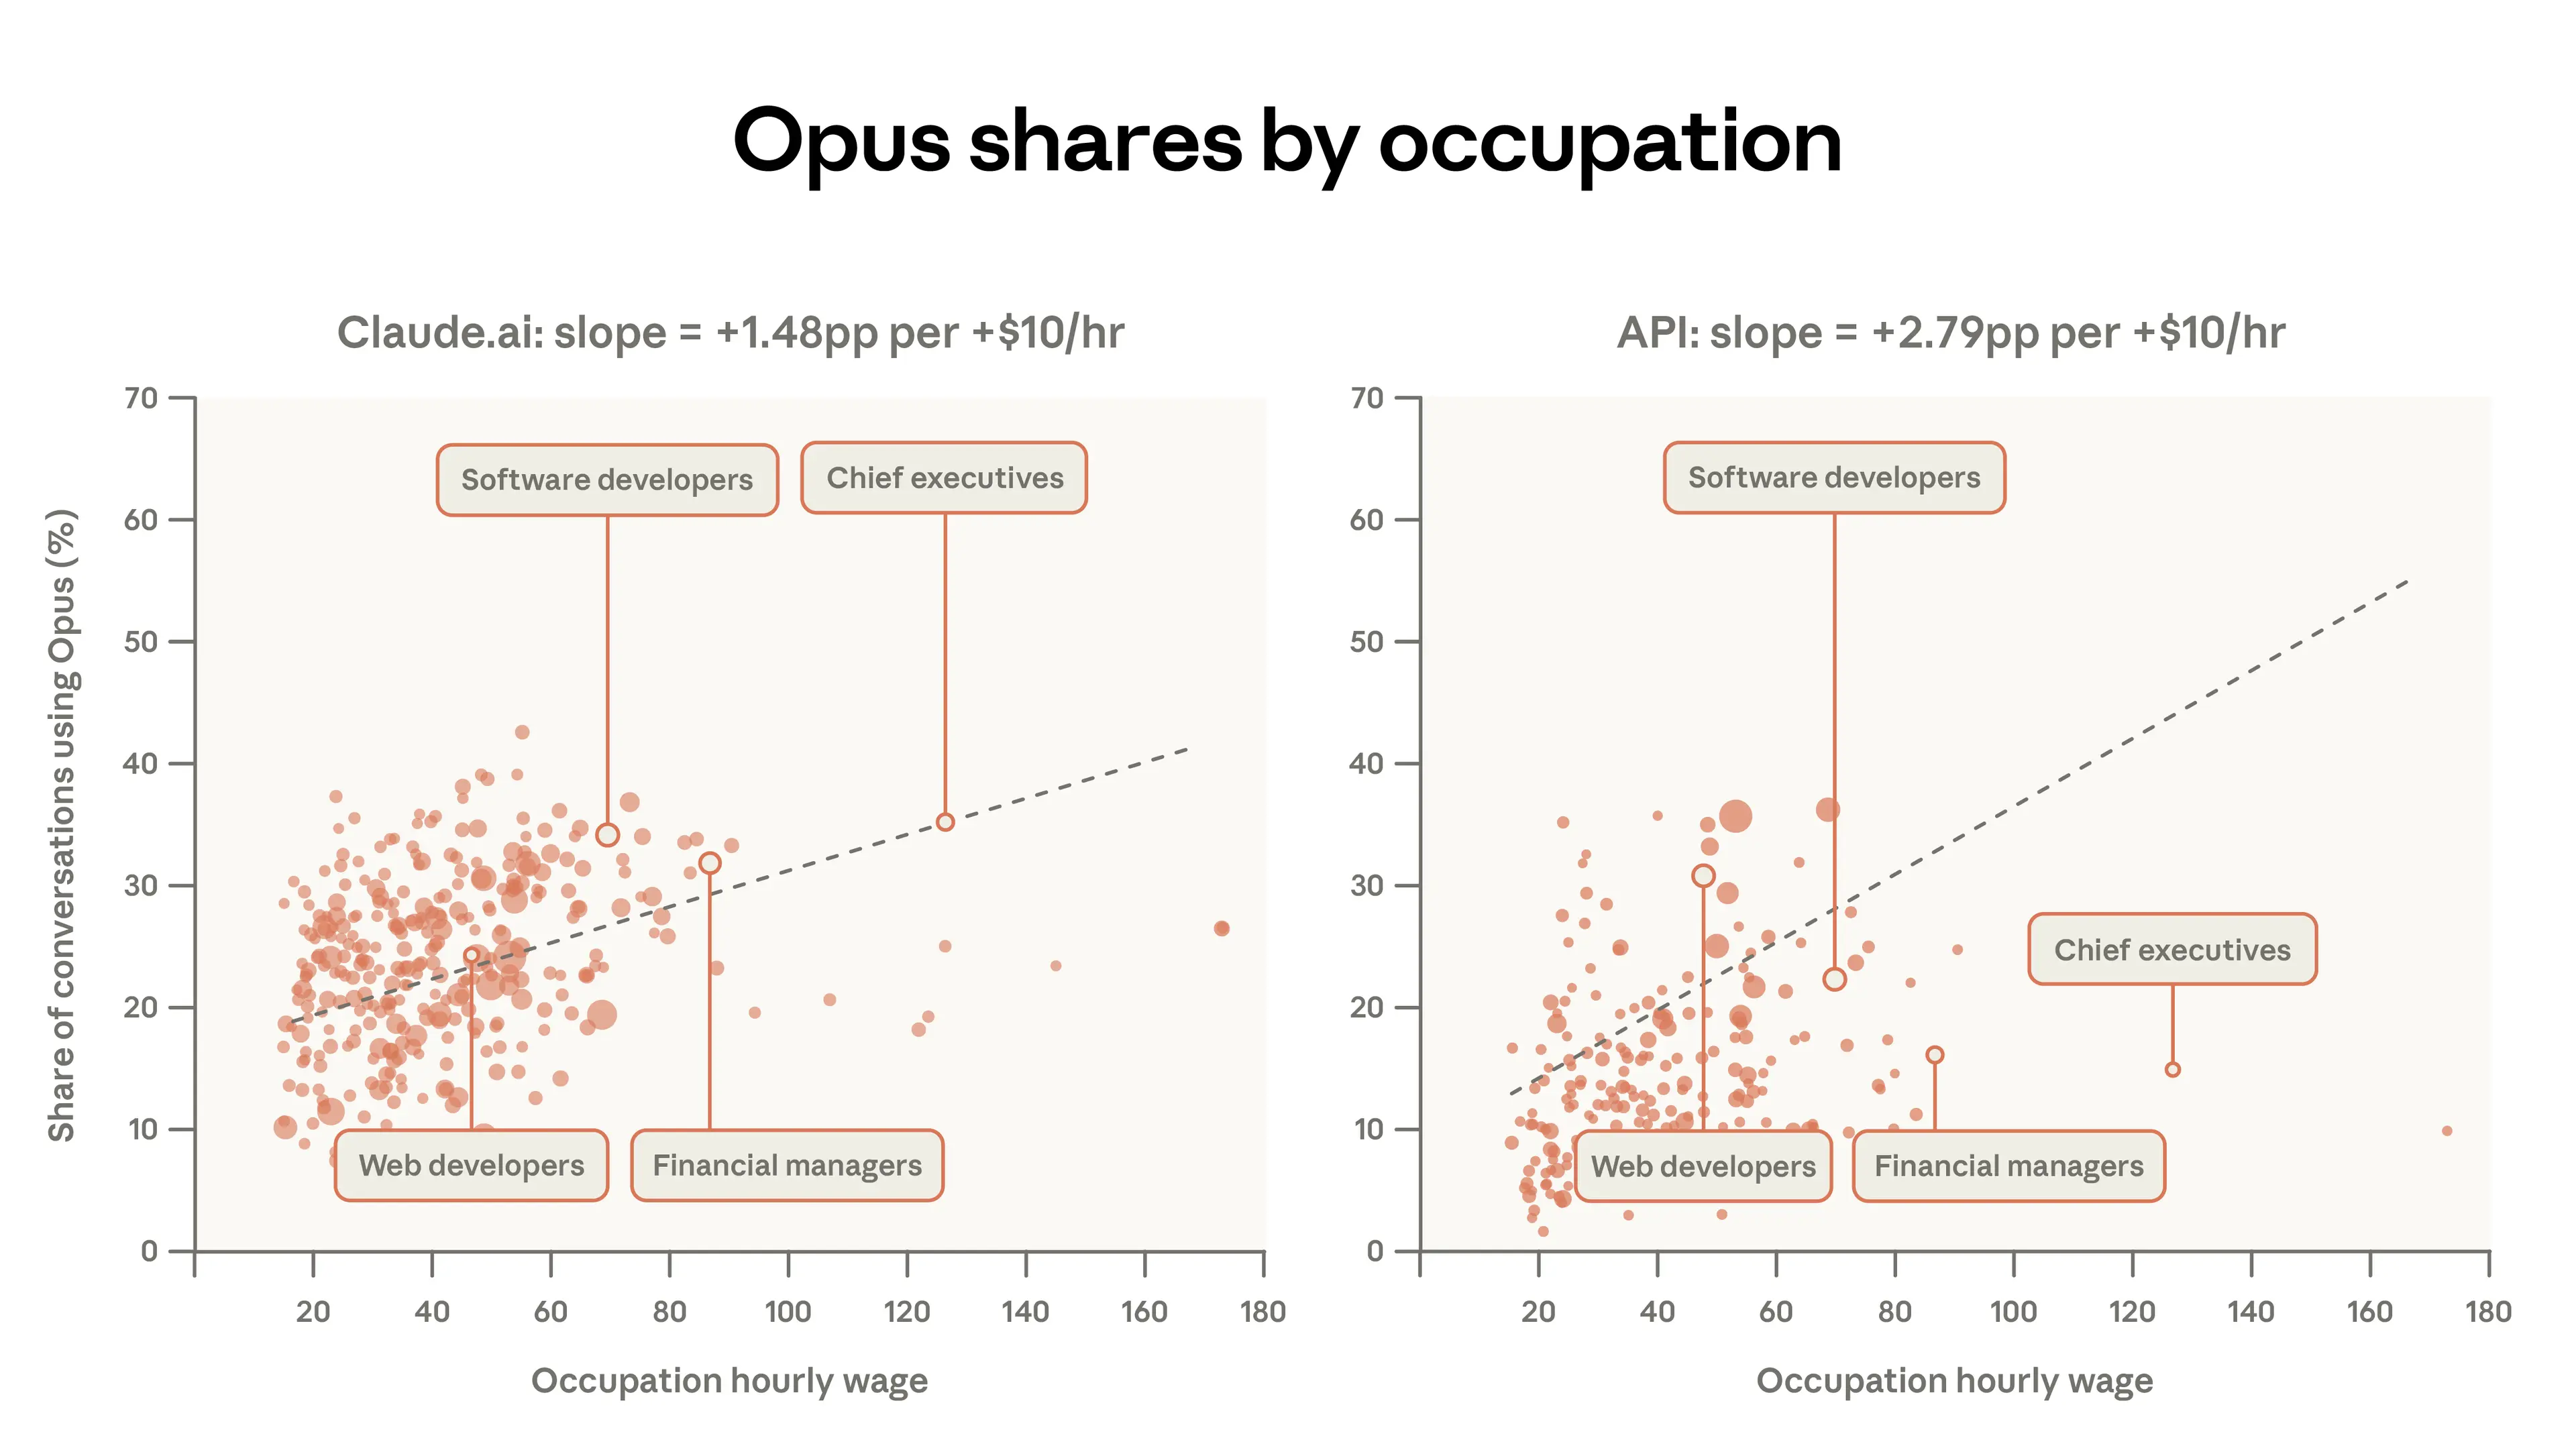
Figure 2.2 below shows this in a more granular way. When users perform tasks associated with higher-paid jobs, they use Opus more often. For example, on Claude.ai, 34% of Software Developer tasks involve Opus compared to just 12% of Tutor tasks. Overall, for every additional $10 of hourly wage for a task, the share of conversations using Opus increases by 1.5 percentage points for Claude.ai users. The 1P API traffic shows much more response to the complexity of the task. Its slope is about twice as large, with the Opus share increasing 2.8 percentage points for every $10 in task value. Users deploying programmatic workflows may have more reason to switch between models compared to web users.
Learning curves
The first Claude model was released in March 2023. Since then, the userbase on both Claude.ai and the API has grown rapidly. Our latest sample contains a mix of users, some of whom signed up for the very first Claude release, and some of whom signed up just the day before we measured their usage. How does one’s tenure with Claude shape their experience with it?9
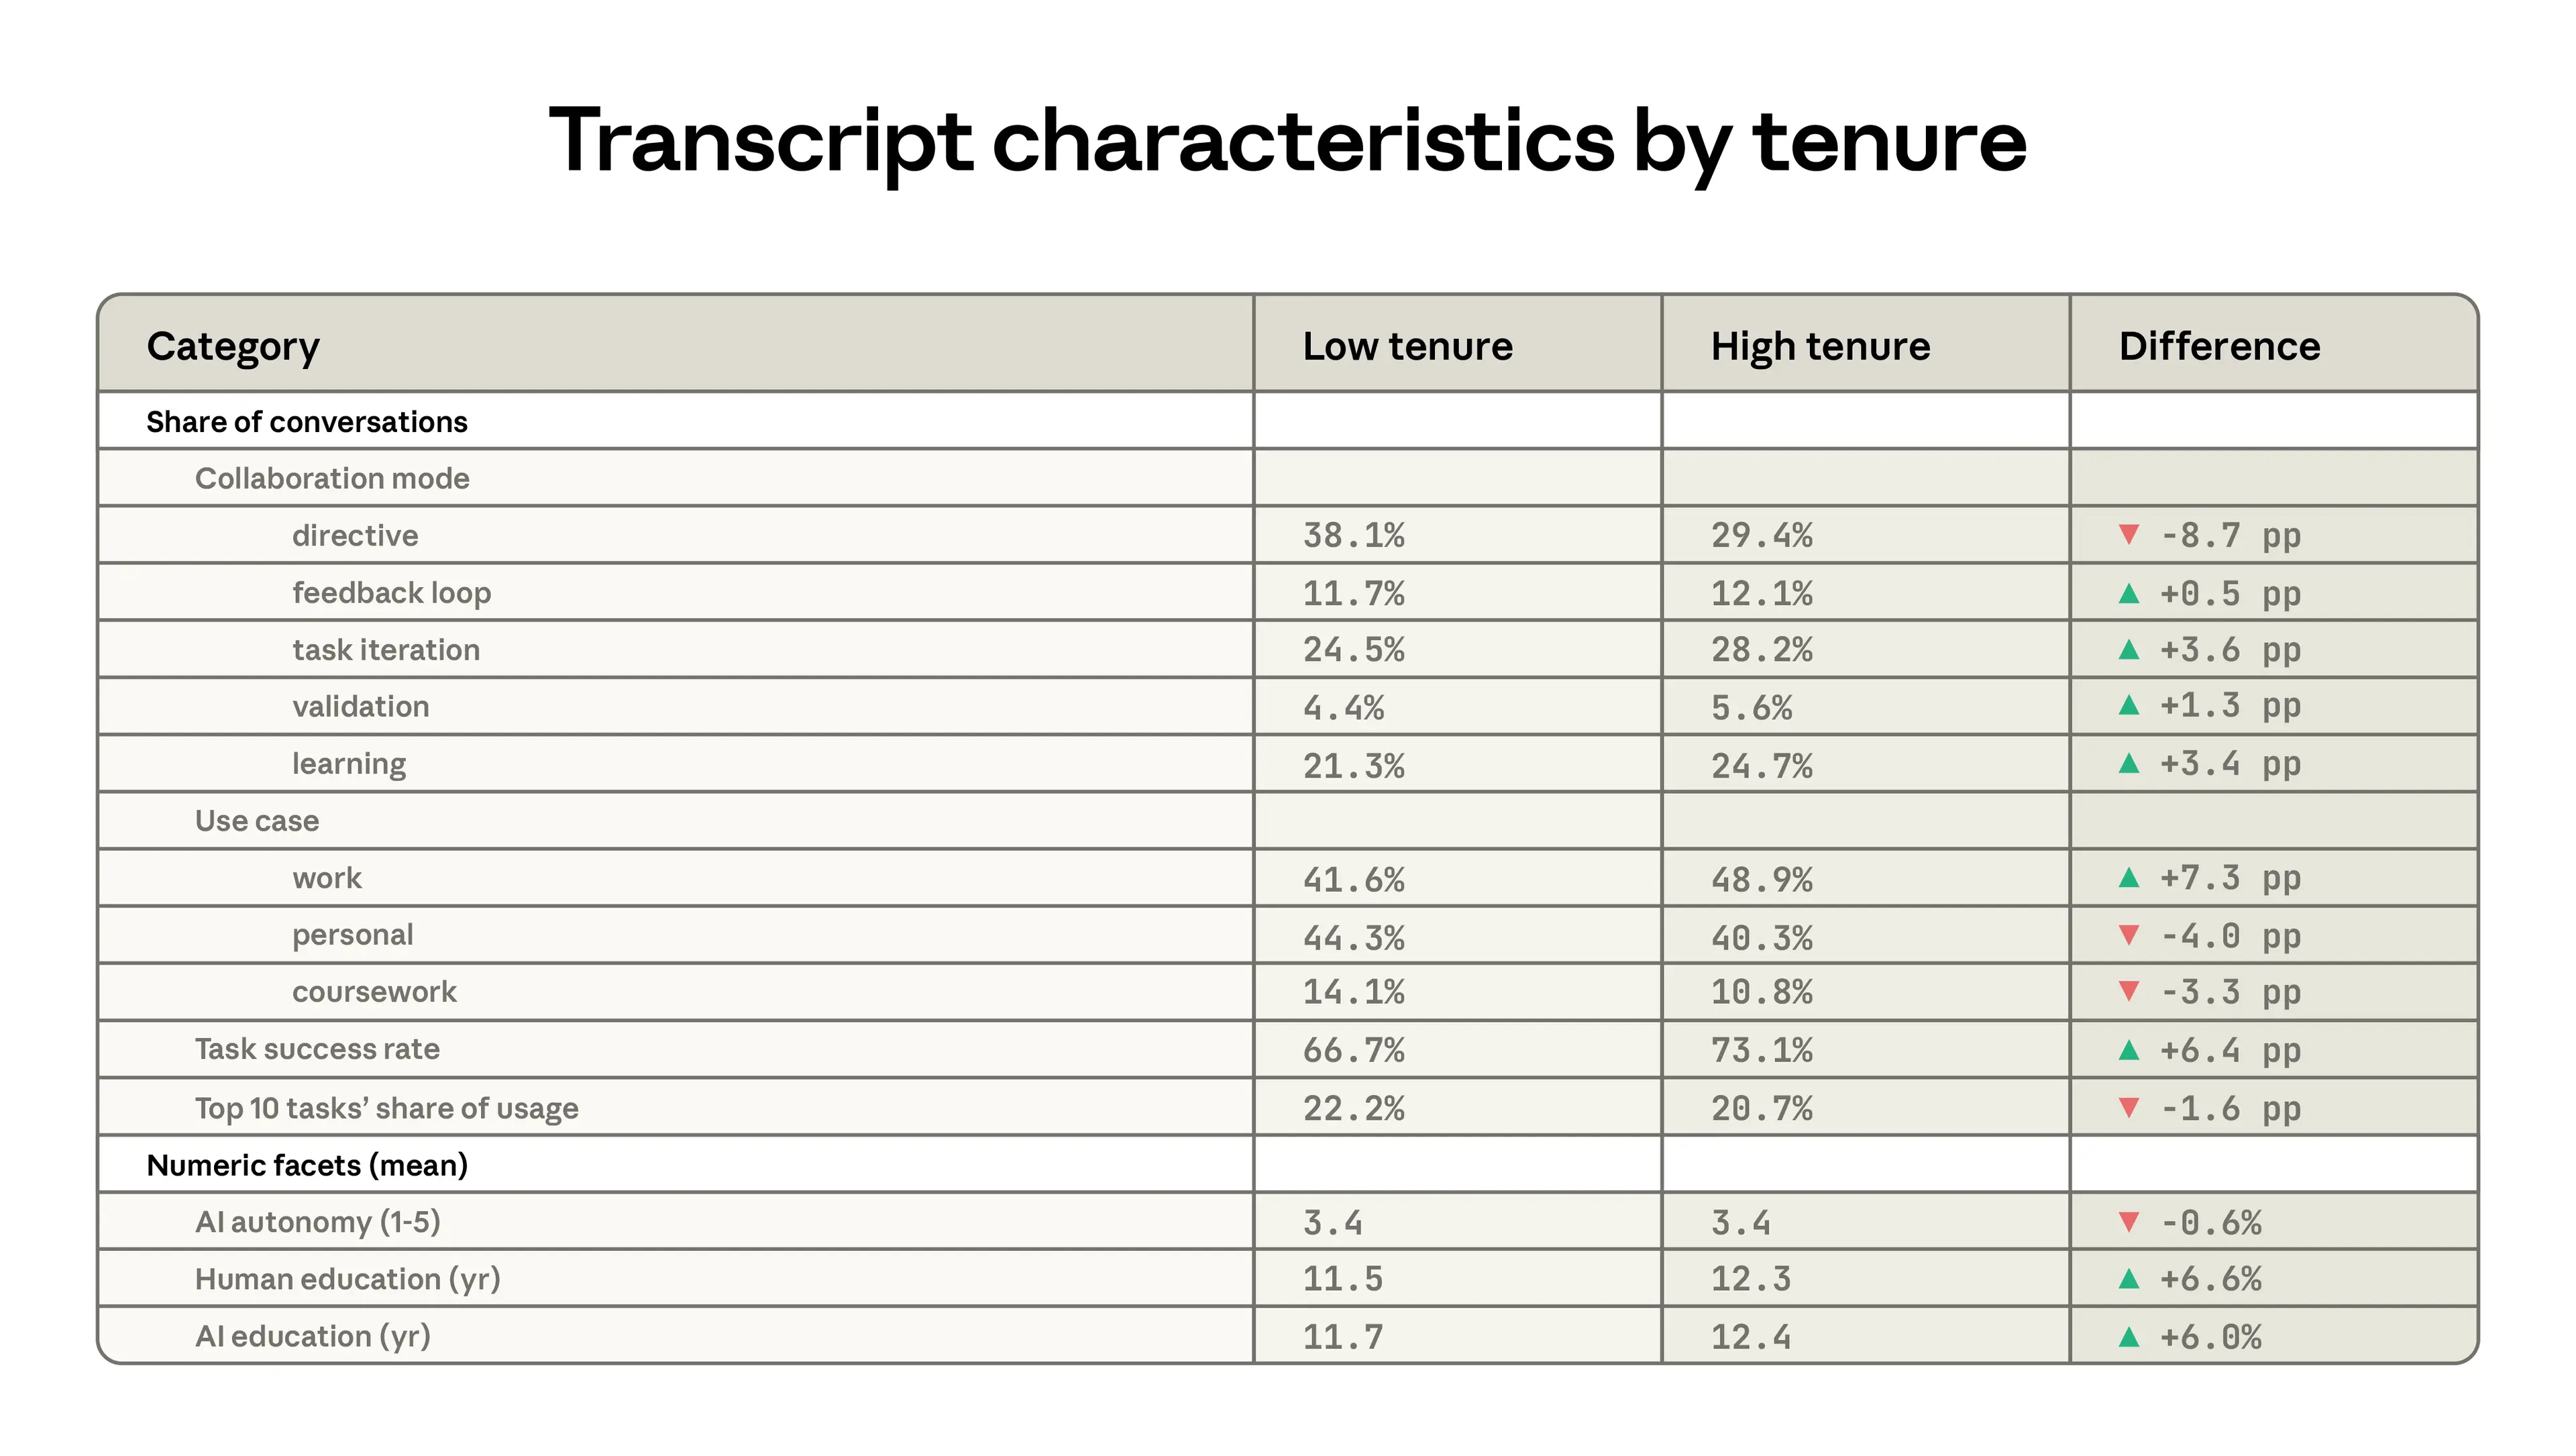
Table 2.1 shows differences between low tenure and high tenure users, where the latter group is defined as having signed up for Claude at least 6 months ago and the low tenure users are everyone else.10 High tenure users are more likely to use Claude to iterate on their work, and much less likely to delegate greater responsibility through directive use patterns. They are 7 percentage points more likely to be using Claude for work, and use Claude for tasks that tend to require higher levels of education. Finally, their usage is less concentrated in certain tasks. The top 10 O*NET tasks account for a slightly lower (20.7% compared to 22.2%) share of usage for the high tenure group.
Below, we dig more into two of the primitives discussed above: the human years of schooling associated with each conversation, and the share of transcripts devoted to personal use.
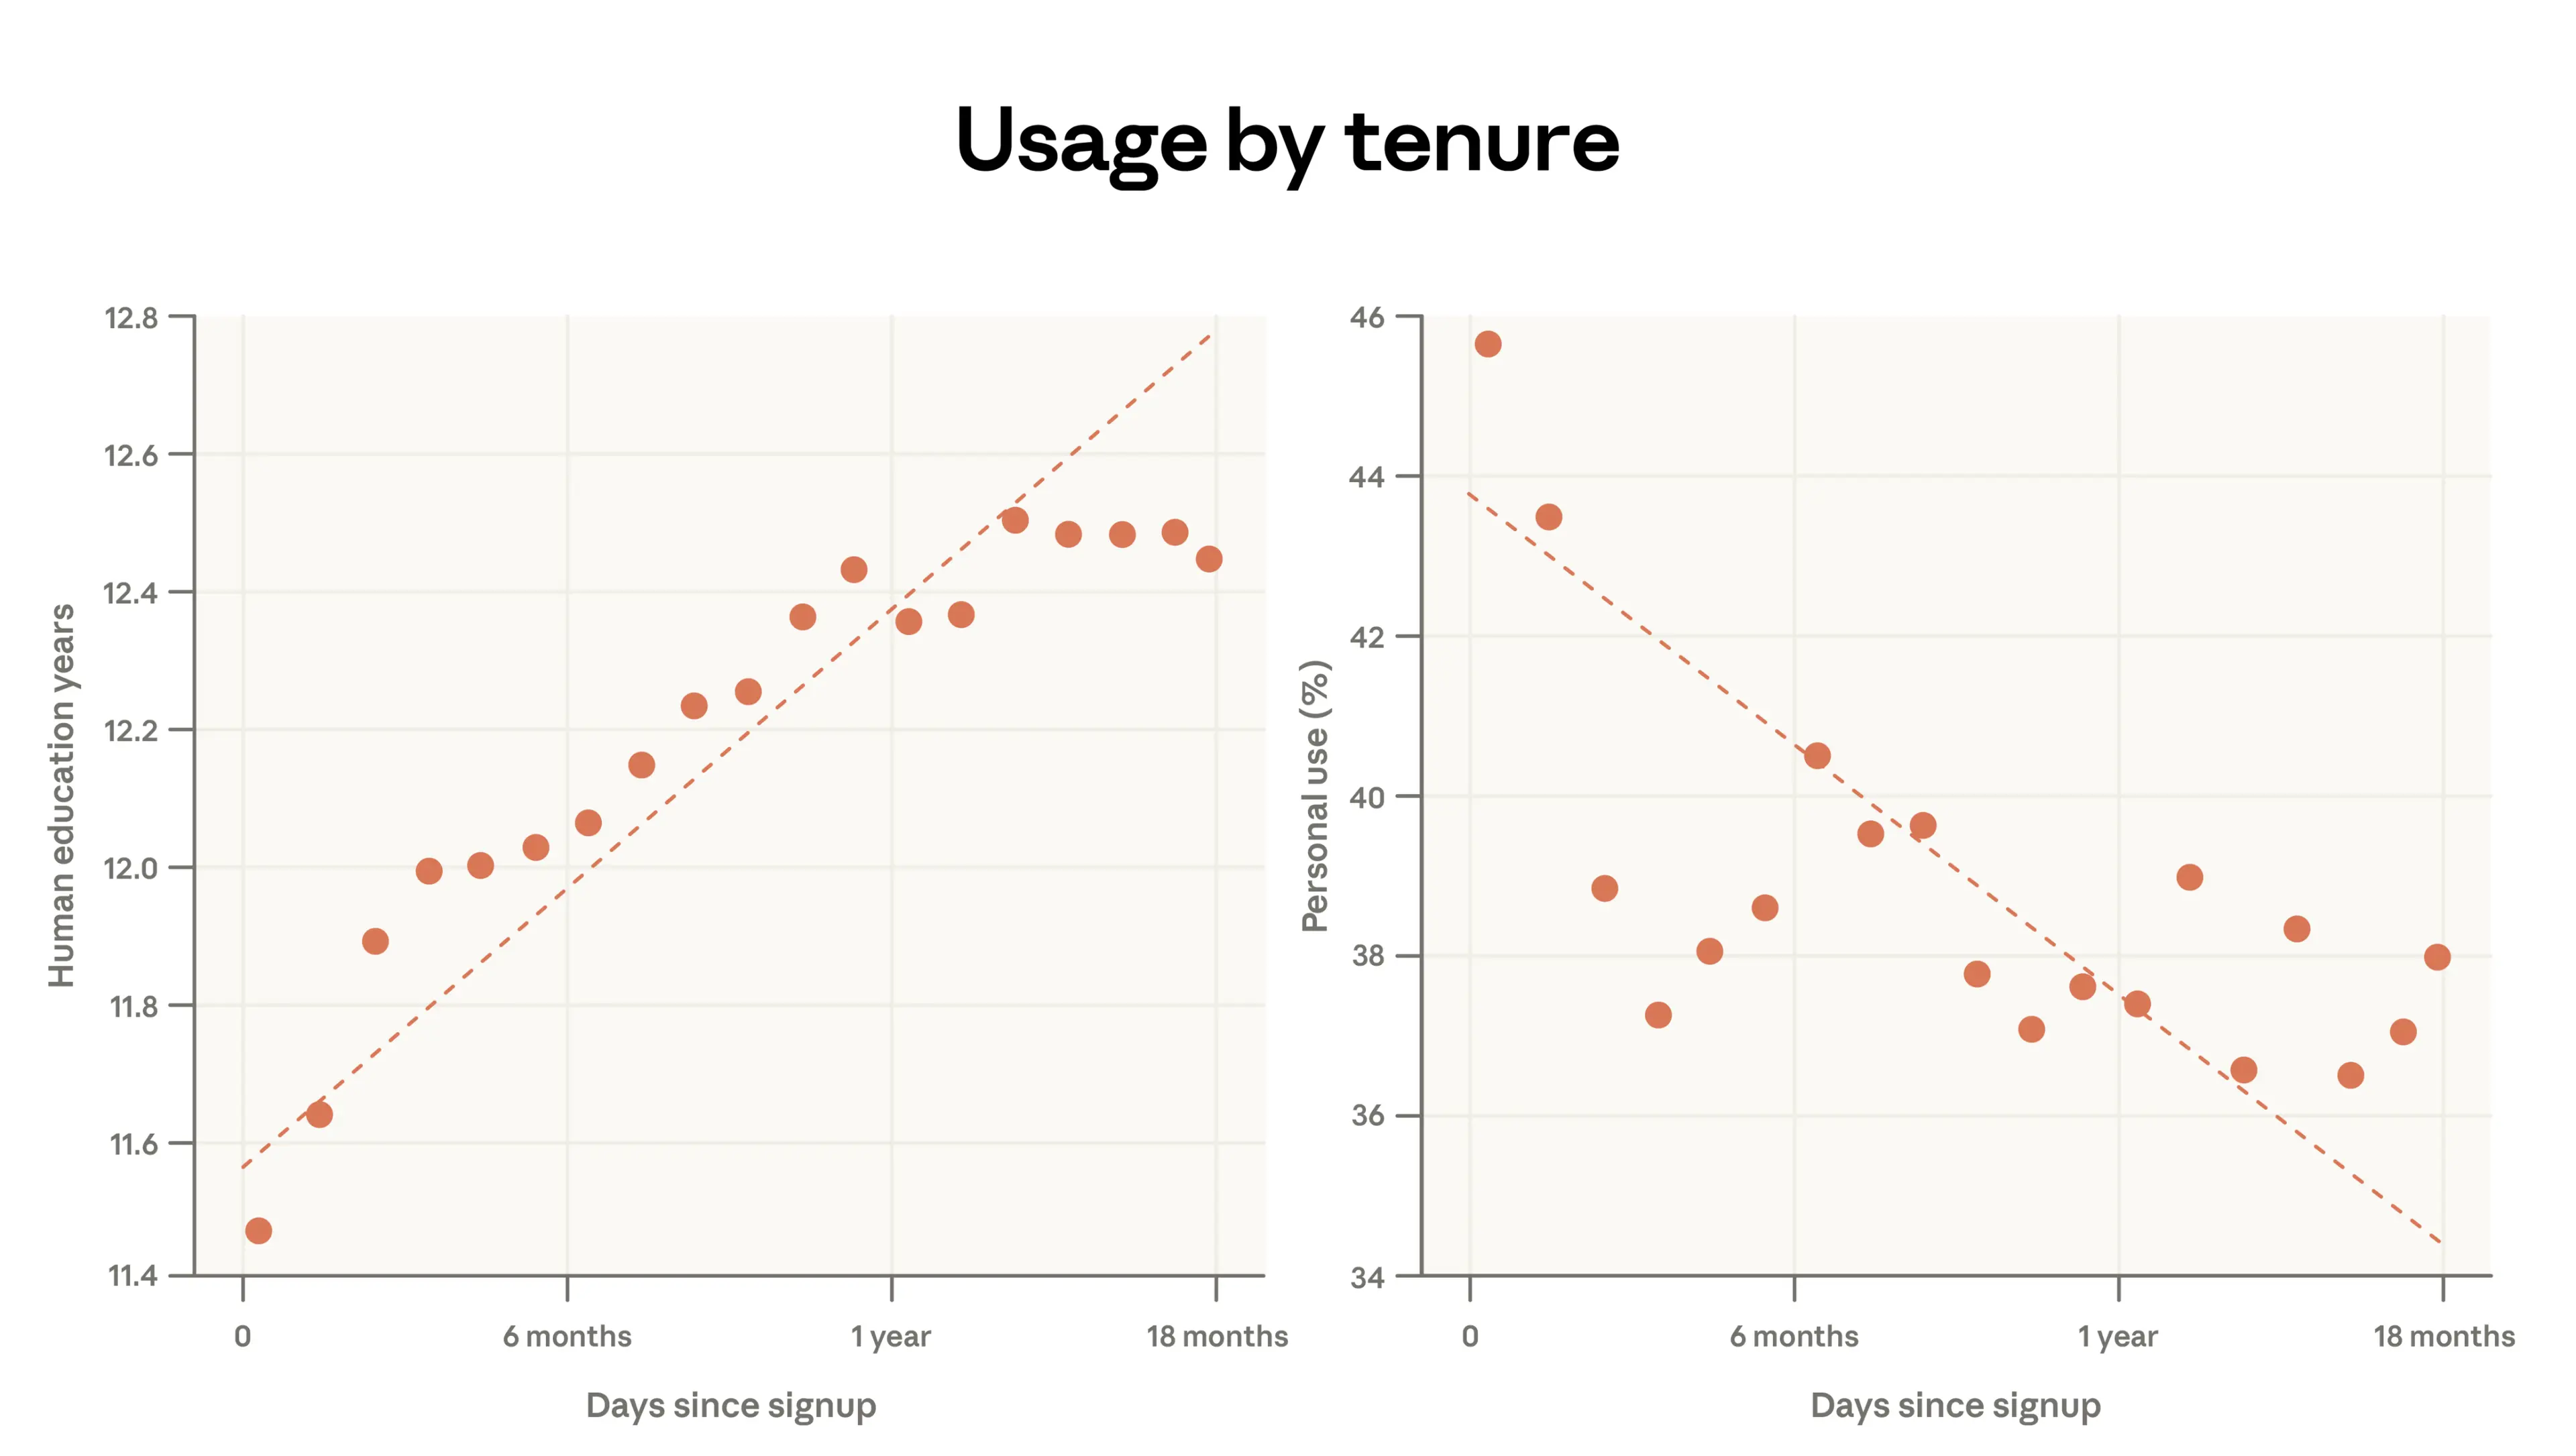
In the panel on the left, we show that the years of schooling needed to understand the human prompt increases by almost 1 year for every additional year of Claude usage. In the panel on the right, we show that at the same time, personal use decreases: people who signed up a year ago devote 38% of their conversations to personal use cases, compared to 44% for the newest users.
Several factors could account for these patterns in the user base of a rapidly advancing all-purpose technology. The high-tenure users are self-selected and the differences here could reflect stable characteristics. They may be computer programmers, for example, who were more likely to be early adopters. Further, there’s an inherent survivorship bias: people who signed up a year before our data pull may be seeing positive results from their usage. We do not observe people who signed up a year ago but are no longer using Claude.
The findings mirror what we saw in our Economic Primitives report: lower-income, less educated countries paradoxically showing more complex use in some cases. The earliest adopters often have high-value, technical use cases. In poorer countries with much lower adoption, these early adopters still dominate the user base.
More casual usage emerges when AI has diffused to a broader share of the population. Indeed, among request clusters, tasks with highest mean tenure included: AI research, git operations, revising manuscripts, and startup fundraising. The tasks with the lowest average tenure have more simple workflows like writing haikus, checking sports scores, and suggesting food for a party.11
Experience effects
We explore these relationships more in Figure 2.4 below, using the log-level data to control granularly for features of the conversation. In the top panel, specification (1) shows a simple bivariate regression with task success as the outcome and the long-tenure indicator as the predictor. Success is Claude’s assessment of whether the conversation was successful, described in our previous report. The plot shows that long-tenure users are about 5 percentage points more likely to have a successful conversation.
This could reflect that higher-tenure users are better at prompting. But what if it reflects that they bring different tasks to Claude—ones more likely to be successful?
In Specification (2), we include fixed effects for specific O*NET tasks and request clusters. This amounts to comparing high- and low-tenure users within the same narrowly defined task, rather than across tasks. For instance, we have a request cluster called “Perform corporate financial analysis, valuation, and modeling for specific companies.” The fixed effects compare high- and low-tenure users within that cluster, and likewise within every other cluster. We would only observe a positive coefficient if, on average, long-tenure users are more successful in these within-task comparisons. This control moderates the effect somewhat, bringing it closer to 3 percentage points.
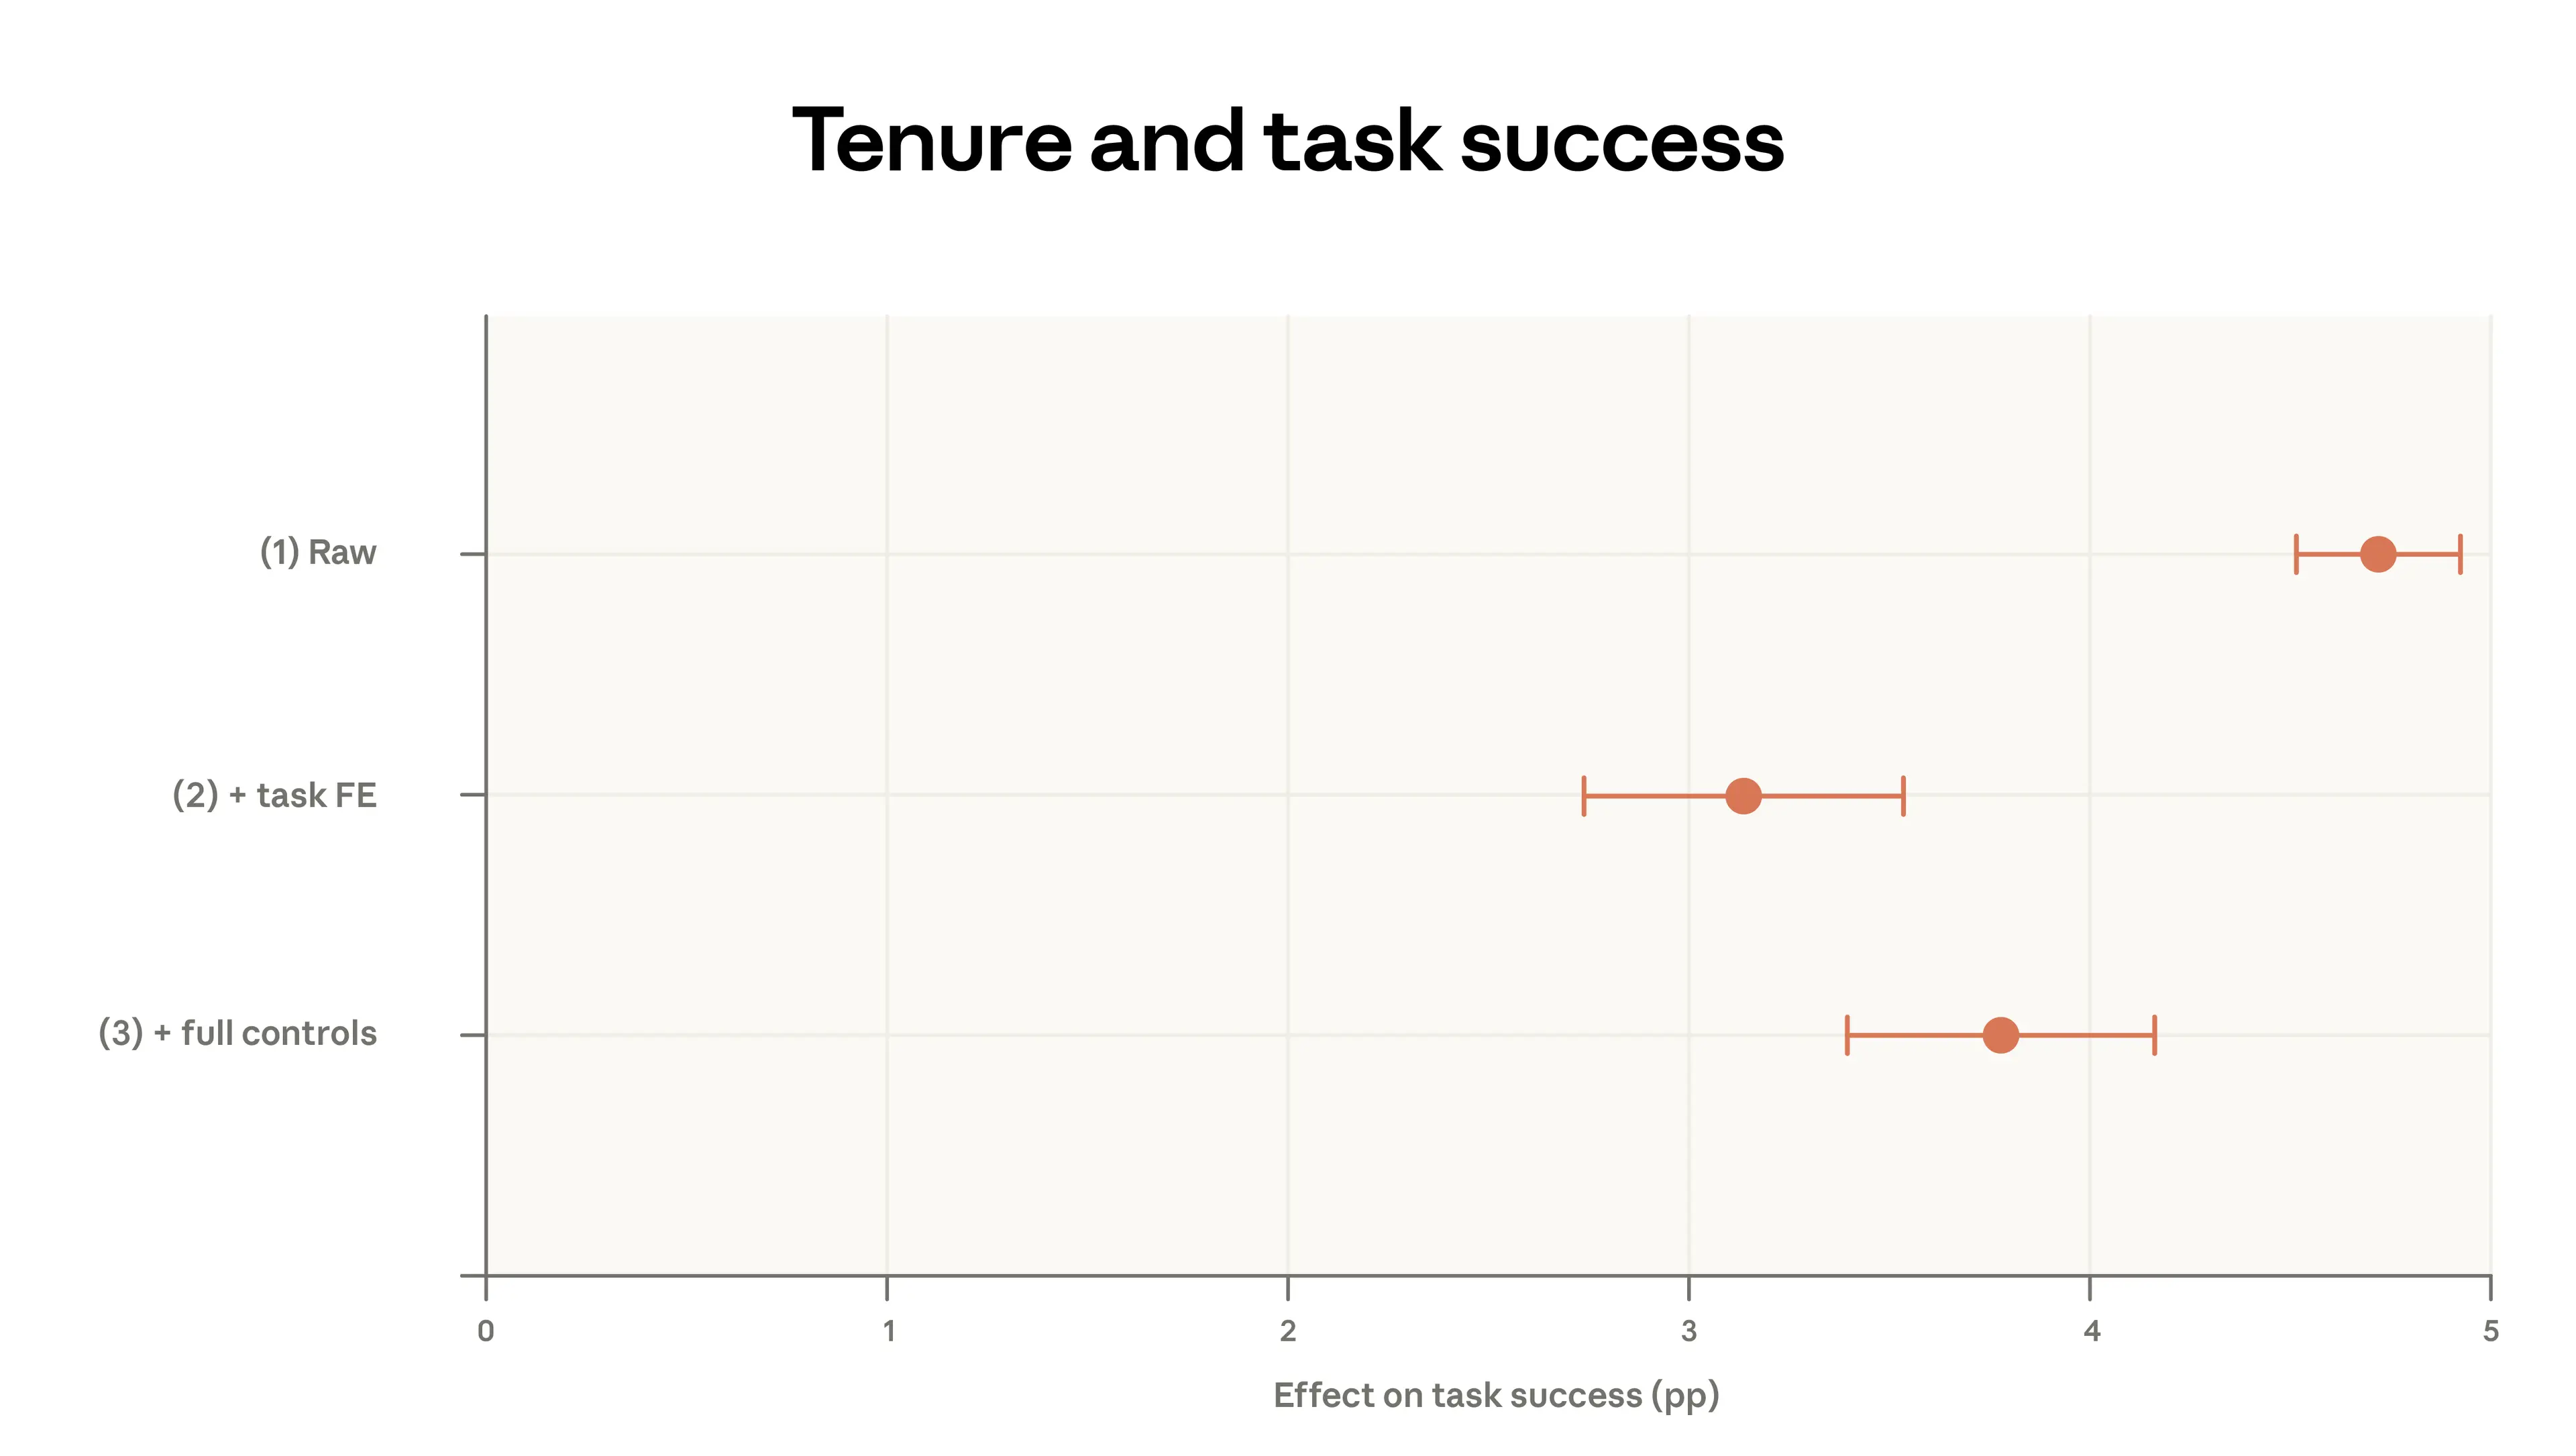
Finally, we ask whether this relationship is affected by higher-tenure users selecting different models, communicating in different languages, having different use cases, or signing on in different countries. This regression yields a slightly higher impact of high tenure, suggesting a 4-percentage-point higher success rate accounting for the full controls.
These results suggest that high-tenure users have more success in their Claude conversations, and that this is not due to simple factors like language or the task being performed. One intriguing potential explanation is that these users have better learned to extract what they want from AI. Facility with these platforms may be a key determinant of success that appears to scale with experience.
Discussion
This report revisited the core measures we use to track Claude usage, and analyzed model selection and success for the first time. Since August 2025, 1P API usage has become more concentrated, with the top 10 O*NET tasks now accounting for 33% of traffic, up from 28%. Claude.ai tasks, on the other hand, have diversified since our November 2025 data. Faster adoption among low-usage states continued in the US, though at a slower pace than in the previous report. Low-adoption countries fell slightly further behind.
With this report, we can begin to trace out how various economic primitives have changed. Coursework fell as a share of usage while personal conversations increased. We also note a slight decrease in the aggregate complexity of prompts in Claude.ai, with conversations in Claude.ai exhibiting less sophisticated inputs and shorter estimated completion times.
Overall, Claude is used for high-value, complex work that is not broadly representative of the US economy. But as the user base has grown, less remunerated tasks have become a slightly larger share of traffic. The average value of tasks, measured as the estimated wage paid to workers in occupations associated with those tasks, has declined on Claude.ai since our first report, while rising among API users. On both surfaces, users bring their most complex tasks to our more powerful model class, Opus. This inflection is stronger for API customers.
More experienced users tend to use Claude more collaboratively, for more work-related reasons, in more complex tasks, and with more success. This pushes back against a hypothesis we made last year that automated use may be more typical of more experienced, sophisticated users; instead, we find that the most advanced users are more likely to iterate with Claude. It’s also consistent with learning-by-doing: the more time one spends using AI, the more effective one becomes at harnessing it.
An alternative interpretation, of course, is that these results are driven by cohort effects or survivorship bias. Early adopters could be more technical. Those who continue using Claude could be those with tasks that it is distinctly well-equipped to do. But carefully controlled regressions rule out simple versions of this confounding, like that long-tenured users bring different kinds of tasks. Over time, we will be able to more cleanly isolate cohort and survivorship bias from learning-by-doing.
These observed differences in success rates could deepen inequalities in the labor market. Economists have long noted the potential for skill-biased technological change: innovations that raise wages for high-skill workers while depressing them for others. Our analysis in this report identifies a channel through which such skill-biased transformation may already be unfolding: early adopters with high-skill tasks have more successful interactions with Claude than later, less technical adopters. These early-adopting users may simultaneously be the most exposed to AI-driven disruption and most aided by AI in these initial, augmentative waves of adoption.
Appendix
Available here.
Data availability
Data from this report is available here.
Authors and acknowledgements
First author block*:
Maxim Massenkoff, Eva Lyubich, Peter McCrory
*Lead authors of the report
Second author block:
Ruth Appel, Ryan Heller
Acknowledgements
Tim Belonax, Keir Bradwell, Andy Braden, Dexter Callender III, Miriam Chaum, Madison Clark, Evan Frondorf, Deep Ganguli, Kunal Handa, Hanah Ho, Owen Kaye-Kauderer, Jennifer Martinez, Miles McCain, Jared Mueller, Kelsey Nanan, Tyler Neylon, Dianne Penn, Sarah Pollack, Ankur Rathi, David Saunders, Michael Stern, Alex Tamkin, Kim Withee, Jack Clark
Citation
@online{anthropic2026aeiv5,
        author = {Maxim Massenkoff and Eva Lyubich and Peter McCrory and Ruth Appel and Ryan Heller},
        title = {Anthropic Economic Index report: Learning curves},
        date = {2026-03-24},
        year = {2026},
        url = {https://www.anthropic.com/research/economic-index-march-2026-report},
}Footnotes
- "First-party API" or 1P API refers to developer traffic routed directly through Anthropic's own programming interface, which is distinct from both Anthropic's consumer-facing Claude.ai application and third-party platforms such as Amazon Bedrock or Google Cloud Vertex.
- This includes data from Claude Code.
- This number uses 2019 O*NET-SOC codes, while previous reports use the 2010 vintage.
- The drop in coursework conversations was 5 percentage points in countries where the school term was active and 12 percentage points in the countries where most students were on break.
- See the Appendix for definitions of the interaction types.
- For example, the task “Compute moisture or salt content, percentages of ingredients, formulas, or other product factors, using mathematical and chemical procedures.” is done only by Food Science Technicians, who have an average wage of $26.15, so this is the value of that task. The data source for this exercise is the May 2024 BLS Occupational Employment and Wage Statistics (OEWS) Tables. When multiple workers do the same task, we average their wages weighting by employment and the fraction of time spent on that task.
- To find the emerging patterns, we filtered for O*NET tasks that (i) appeared at least 300 times in the current data and (ii) showed at least 2x growth compared to the previous report.
- The range is given to reflect the different estimates from running the model in our previous report with (5 years) or without (9 years) weights.
- In this analysis, we use log-level data to estimate the models with the same privacy thresholds. See the Appendix for more on the methodology.
- These results are similar however we define high tenure.
- Our sampling period overlapped with the release of our Super Bowl advertisements, which brought many first-time users.
Related content
Project Fetch: Phase two
We report results from our latest test of whether Claude can help Anthropic employees perform sophisticated robotics tasks. We found that Claude Opus 4.7, operating without human assistance, was about 20 times faster than the fastest human team at all tasks completed by participants less than a year ago.
Read moreAgentic coding and persistent returns to expertise
This report provides evidence on how Claude Code is used in practice, based on a privacy-preserving analysis of around 400,000 interactive sessions from around 235,000 people between October 2025 and April 2026.
Read more