
Key Findings
- We introduce a new measure of AI displacement risk, observed exposure, that combines theoretical LLM capability and real-world usage data, weighting automated (rather than augmentative) and work-related uses more heavily
- AI is far from reaching its theoretical capability: actual coverage remains a fraction of what's feasible
- Occupations with higher observed exposure are projected by the BLS to grow less through 2034
- Workers in the most exposed professions are more likely to be older, female, more educated, and higher-paid
- We find no systematic increase in unemployment for highly exposed workers since late 2022, though we find suggestive evidence that hiring of younger workers has slowed in exposed occupations
Introduction
The rapid diffusion of AI is generating a wave of research measuring and forecasting its impacts on labor markets. But the track record of past approaches gives reason for humility.
For example, a prominent attempt to measure job offshorability identified roughly a quarter of US jobs as vulnerable, but a decade on, most of those jobs maintained healthy employment growth. The government’s own occupational growth forecasts, while directionally correct, have added little predictive value beyond linear extrapolation of past trends. Even in hindsight, the impact of major economic disruptions on the labor market is often unclear. Studies on the employment effects of industrial robots reach opposing conclusions, and the scale of job losses attributed to the China trade shock continues to be debated.1
In this paper, we present a new framework for understanding AI’s labor market impacts, and test it against early data, finding limited evidence that AI has affected employment to date. Our goal is to establish an approach for measuring how AI is affecting employment, and to revisit these analyses periodically. This approach won't capture every channel through which AI could reshape the labor market, but by laying this groundwork now, before meaningful effects have emerged, we hope future findings will more reliably identify economic disruption than post-hoc analyses.
It is possible that the impacts of AI will be unmistakable. This framework is most useful when the effects are ambiguous—and could help identify the most vulnerable jobs before displacement is visible.
Counterfactuals
Causal inference is easier when the effects are large and sudden. The COVID-19 pandemic and accompanying policy measures caused economic disruption so stark that sophisticated statistical approaches were unnecessary for many questions. For example, unemployment jumped sharply in the early weeks of the pandemic, leaving little room for alternative explanations.
The impacts of AI, however, might be less like COVID and more like the internet or trade with China. The effects may not be immediately clear from aggregate unemployment data; factors like trade policy and the business cycle could cloud interpretations of trend lines.
One common approach is to compare outcomes between more or less AI-exposed workers, firms, or industries, in order to isolate the effect of AI from confounding forces.2 Exposure is typically defined at the task level: AI can grade homework but not manage a classroom, for example, so teachers are considered less exposed than workers whose entire job can be performed remotely.
Our work follows this task-based approach, incorporating measures of theoretical AI capability and real-world usage, before aggregating to occupations.3
Measuring exposure
Our approach combines data from three sources.
- The O*NET database, which enumerates tasks associated with around 800 unique occupations in the US.
- Our own usage data (as measured in the Anthropic Economic Index).
- Task-level exposure estimates from Eloundou et al. (2023), which measure whether it is theoretically possible for an LLM to make a task at least twice as fast.
Eloundou et al.’s metric, β, scores tasks on a simple scale: 1 if a task can be doubled in speed by an LLM alone, 0.5 if it requires additional tools or software built on top of the LLM, and 0 otherwise.4
Why might actual usage fall short of theoretical capability? Some tasks that are theoretically possible may not show up in usage because of model limitations. Others may be slow to diffuse due to legal constraints, specific software requirements, human verification steps, or other hurdles. For example, Eloundou et al. mark “Authorize drug refills and provide prescription information to pharmacies” as fully exposed (β=1). We have not observed Claude performing this task, although the assessment seems correct in that it could theoretically be sped up by an LLM.
That said, these measures of theoretical capability and actual usage are highly correlated. As Figure 1 shows, 97% of the tasks observed across the previous four Economic Index reports fall into categories rated as theoretically feasible by Eloundou et al. (β=0.5 or β=1.0).
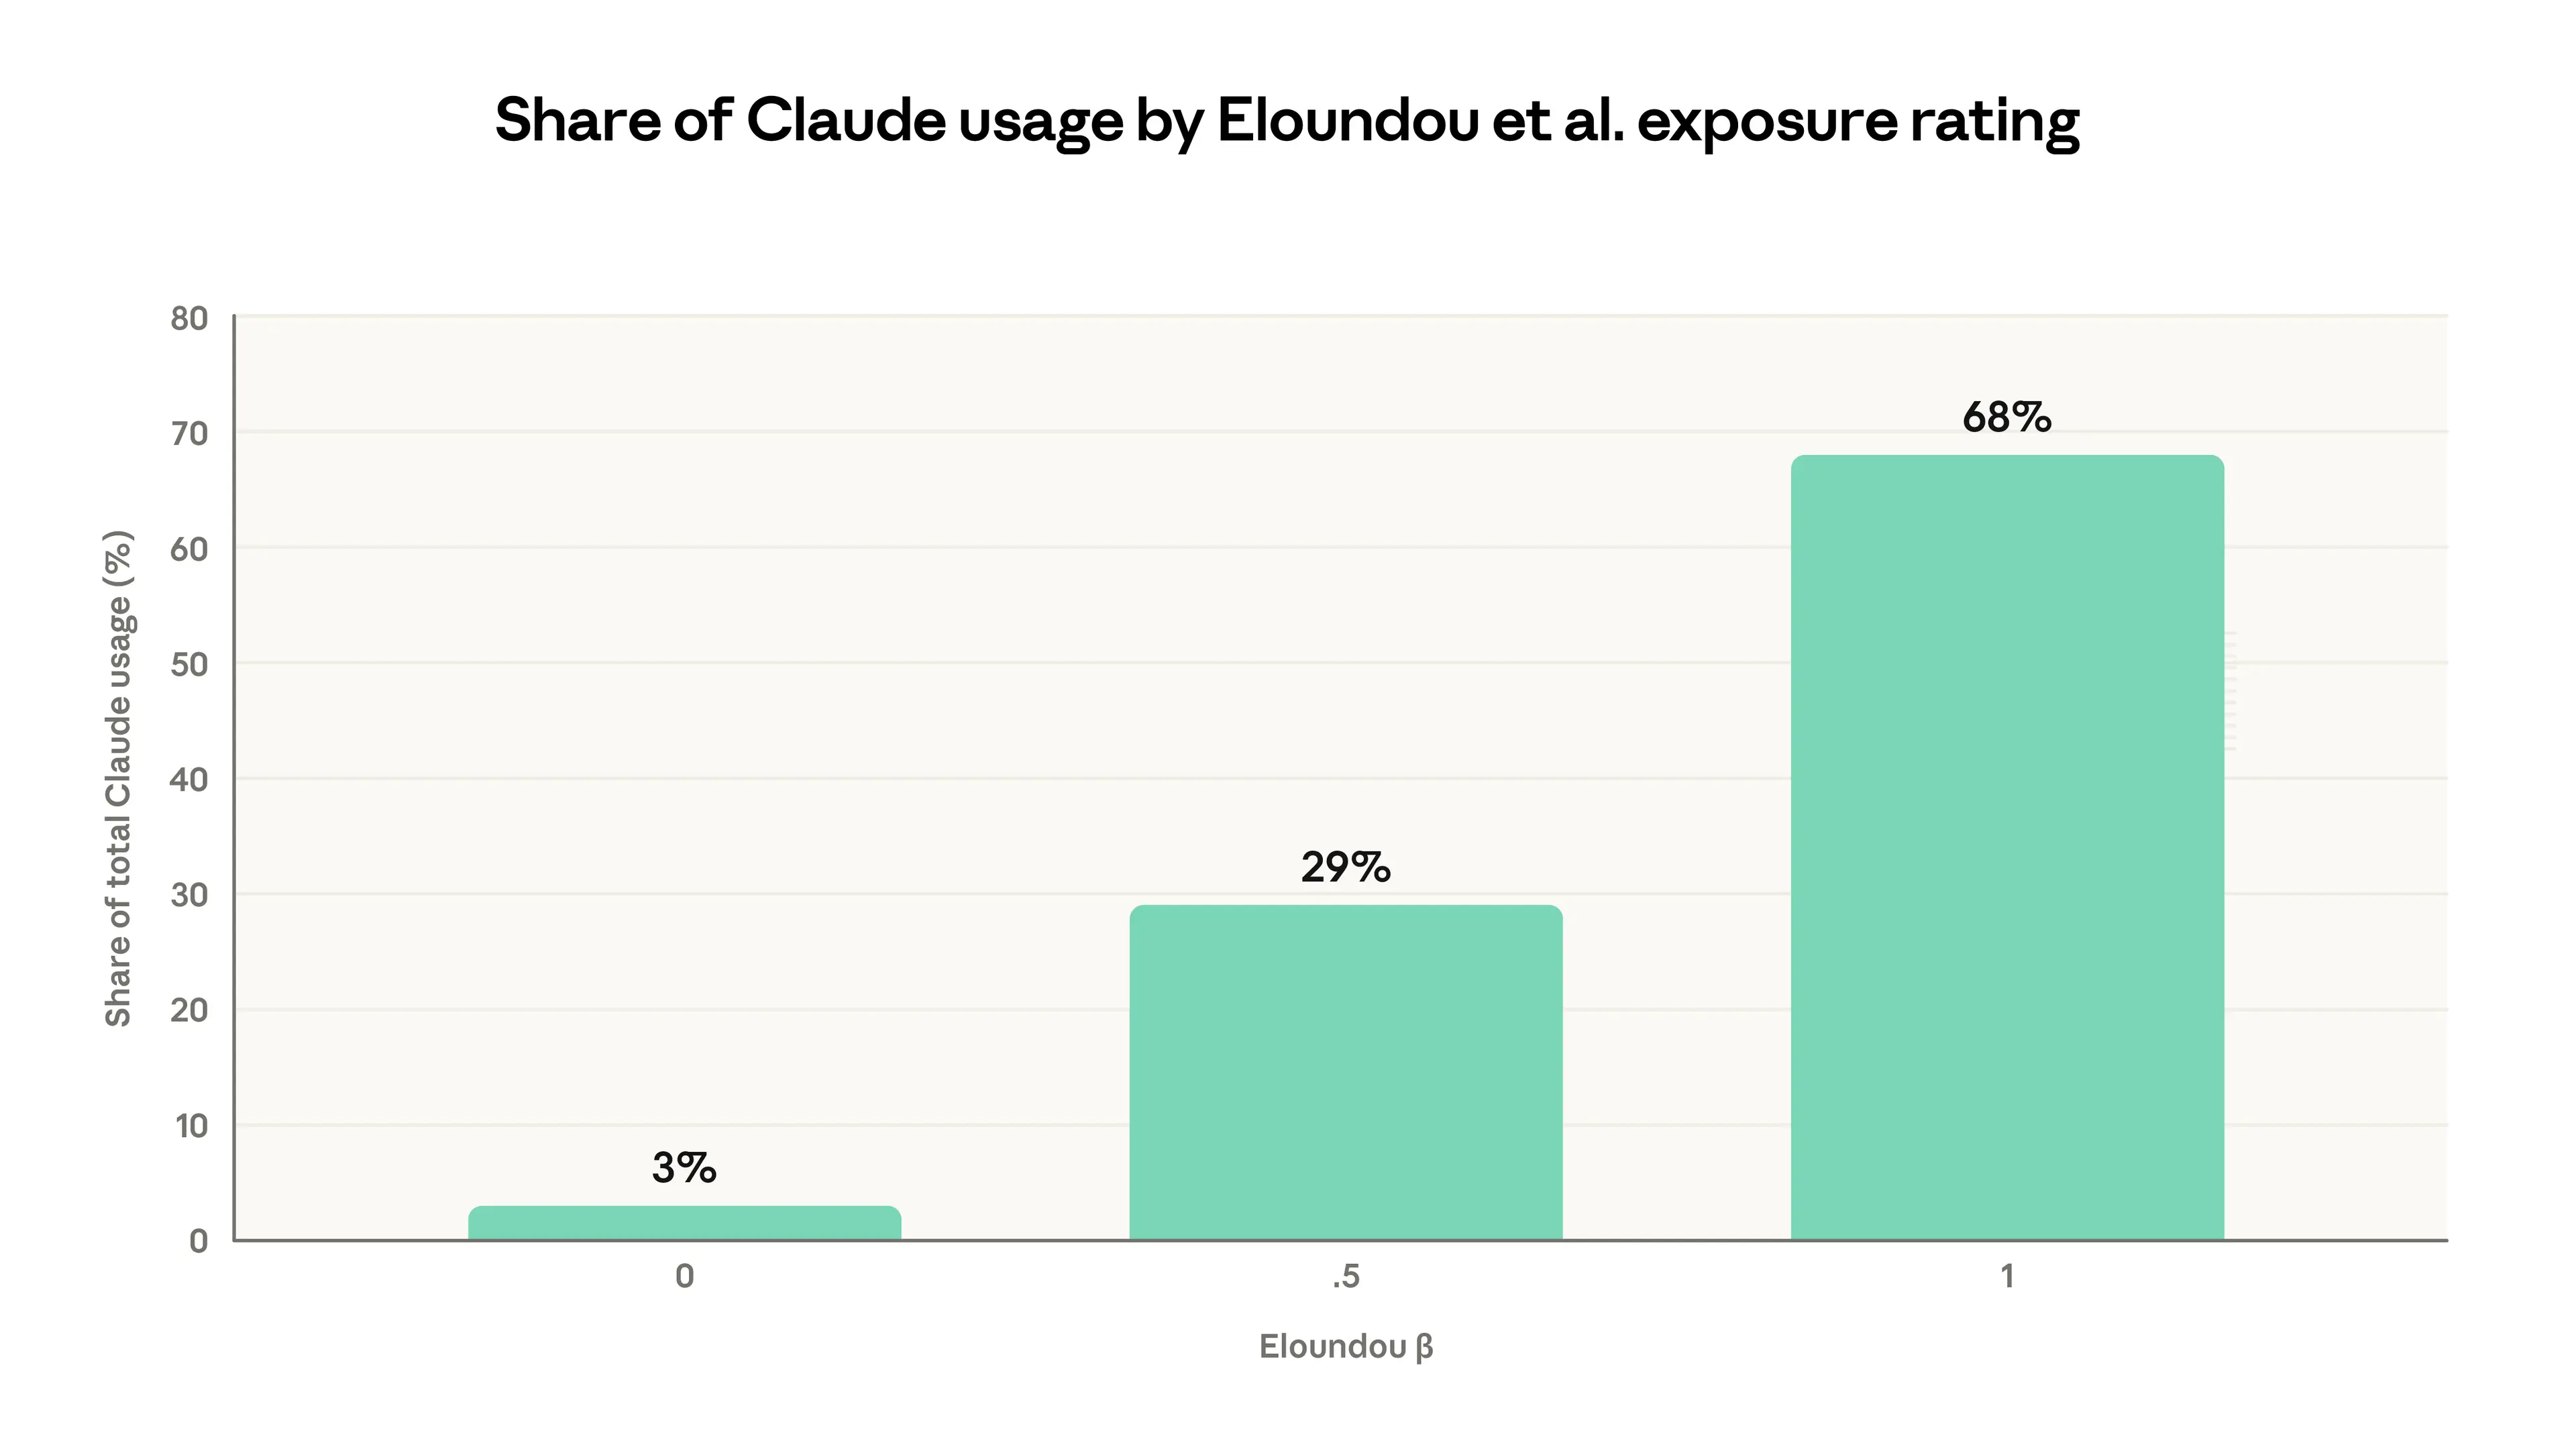
This figure shows Claude usage distributed across O*NET tasks grouped by their theoretical AI exposure. Tasks rated β=1 (fully feasible for an LLM alone) account for 68% of observed Claude usage, while tasks rated β=0 (not feasible) account for just 3%. Data on Claude usage comes from the previous four Economic Index reports.
A new measure of occupational exposure
Our new measure, observed exposure, is meant to quantify: of those tasks that LLMs could theoretically speed up, which are actually seeing automated usage in professional settings? Theoretical capability encompasses a much broader range of tasks. By tracking how that gap narrows, observed exposure provides insight into economic changes as they emerge.
Our measure qualitatively captures several aspects of AI usage that we think are predictive of job impacts. A job's exposure is higher if:
- Its tasks are theoretically possible with AI
- Its tasks see significant usage in the Anthropic Economic Index5
- Its tasks are performed in work-related contexts
- It has a relatively higher share of automated use patterns or API implementation
- Its AI-impacted tasks make up a larger share of the overall role6
We give mathematical details in the Appendix. We count tasks that are theoretically capable with an LLM as covered if they have seen sufficient work-related usage in Claude traffic. We then adjust for how the task is being carried out: fully automated implementations receive full weight, while augmentative use receives half weight. Finally, the task-level coverage measures are averaged to the occupation level weighted by the fraction of time spent on each task.
Figure 2 shows observed exposure (in red) compared to β from Eloundou et al. (in blue), illustrating the difference between theoretical and actual use on our platform, grouped by broad occupational categories. We calculate this by first averaging to the occupation level weighting by our time fraction measure, then averaging to the occupation category weighting by total employment. For example, the β measure shows scope for LLM penetration in the majority of tasks in Computer & Math (94%) and Office & Admin (90%) occupations.
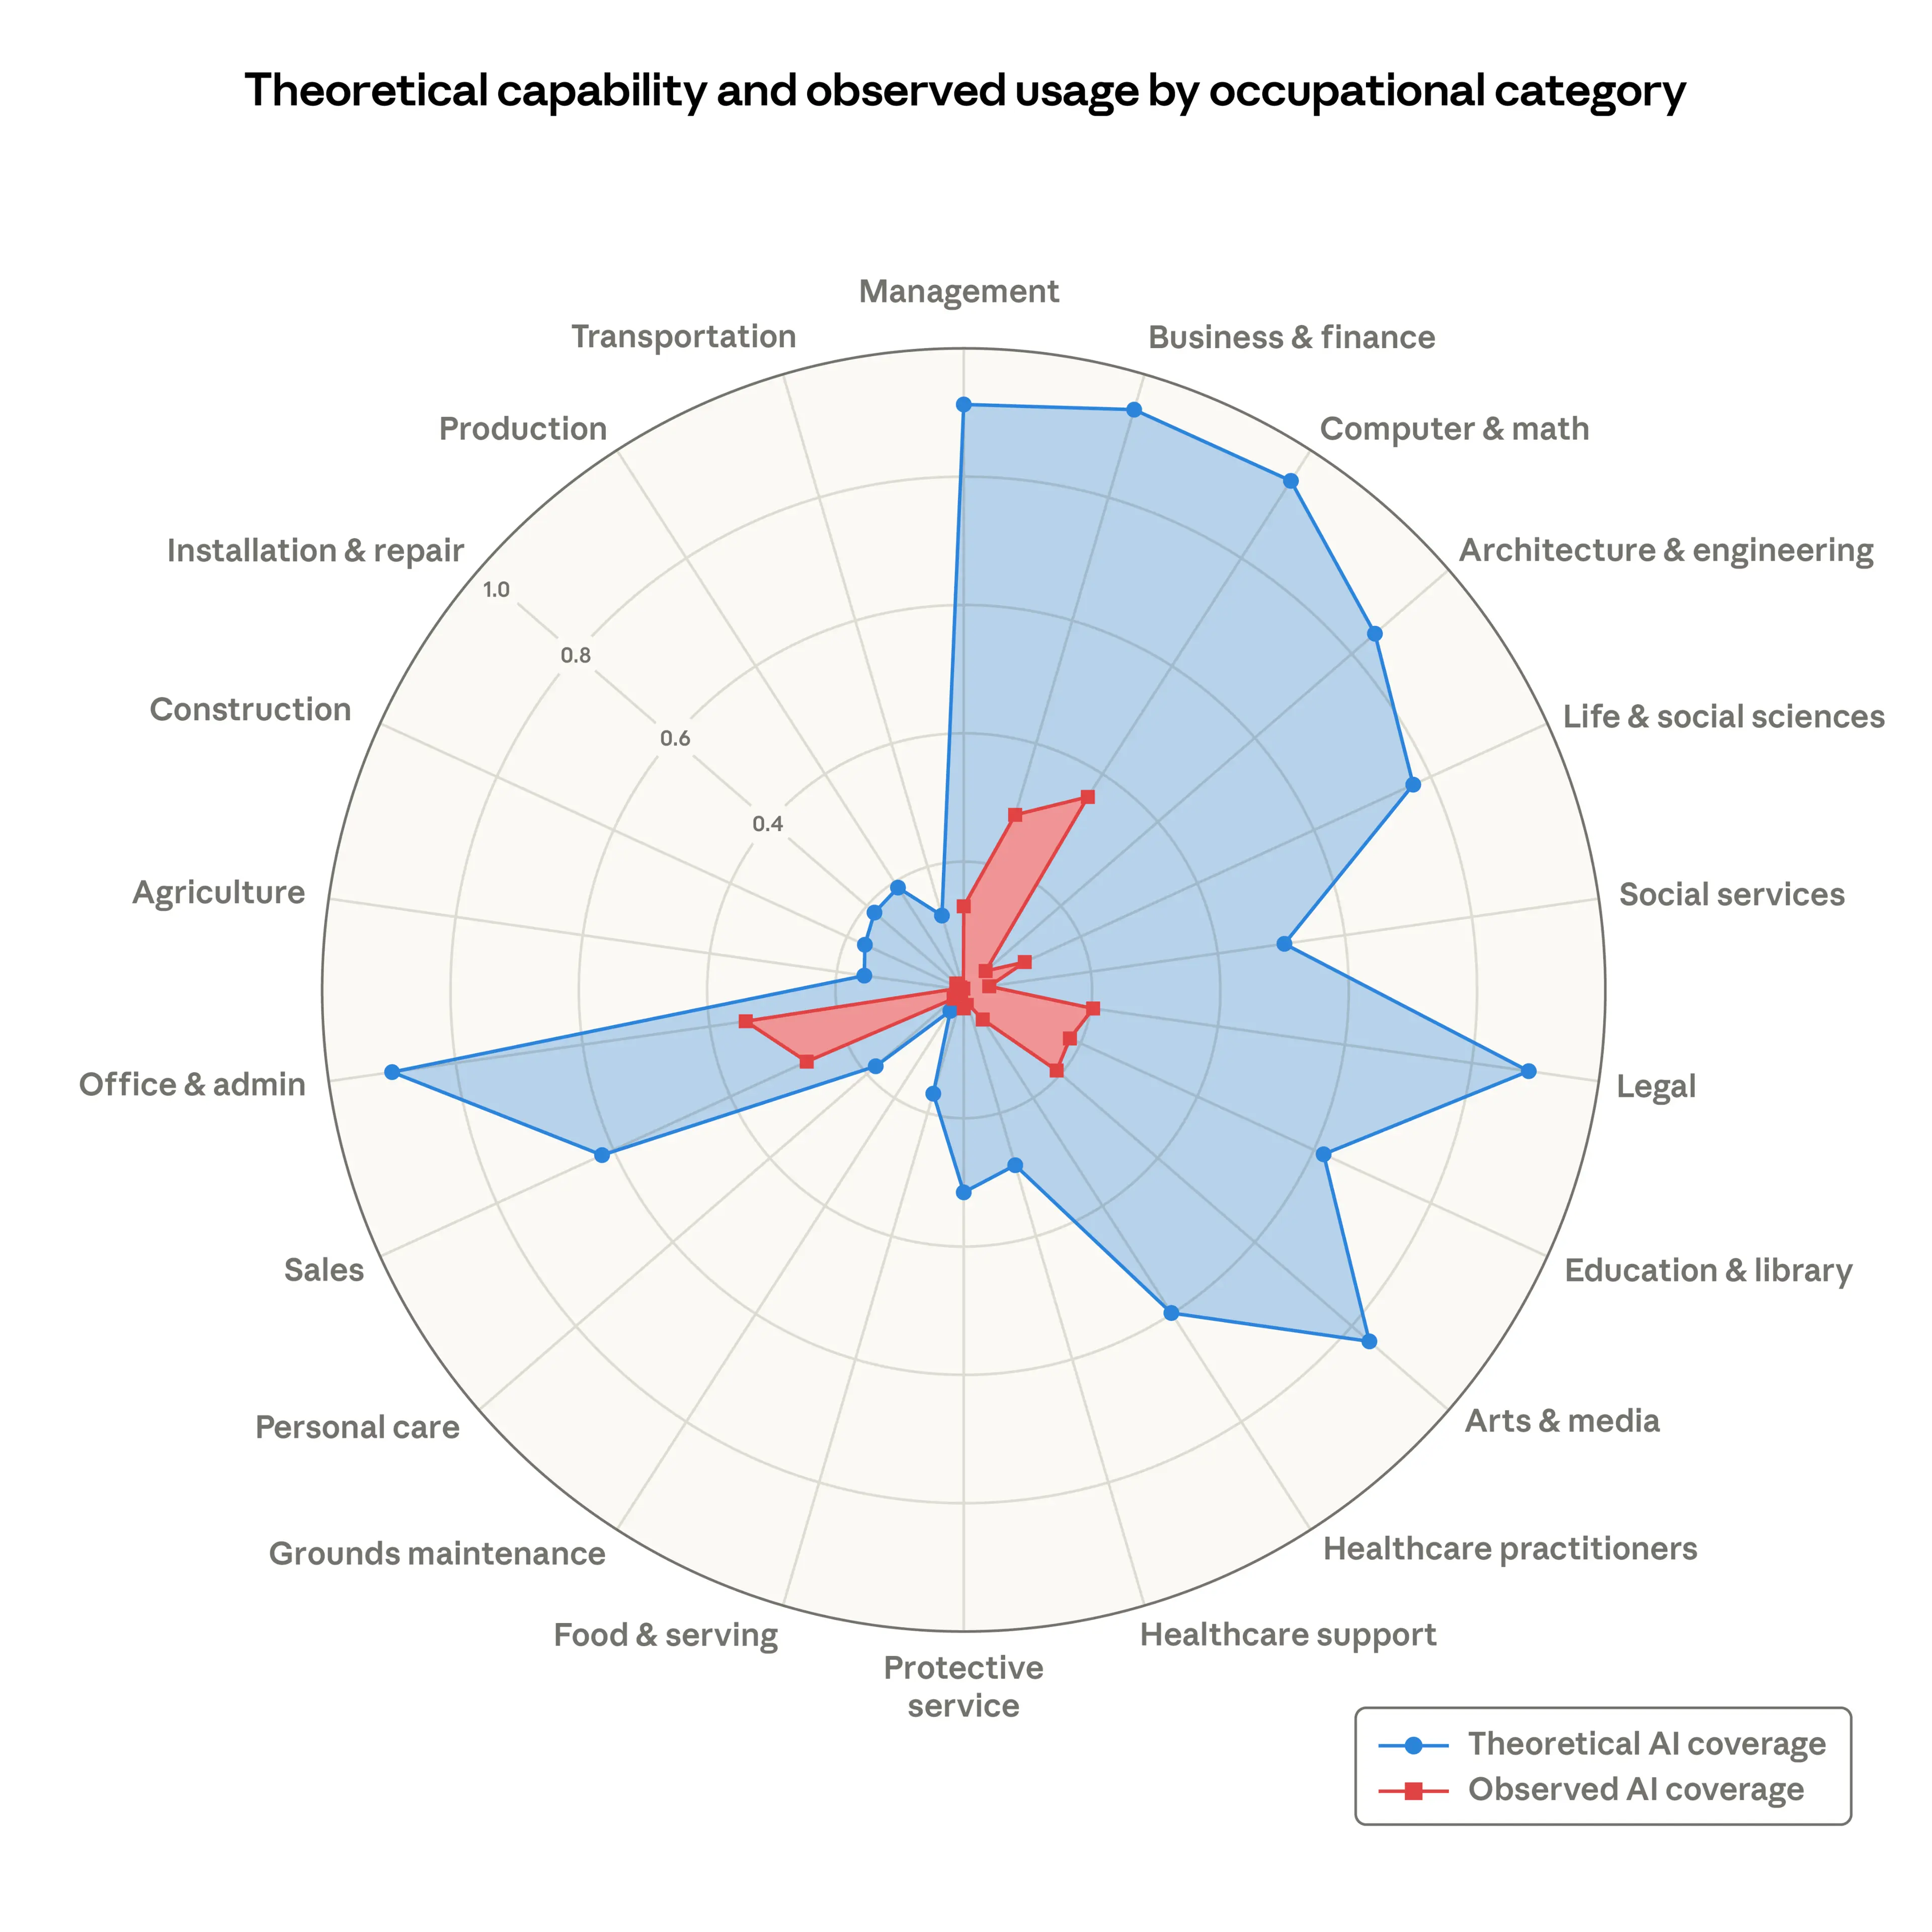
Share of job tasks that LLMs could theoretically perform (blue area) and our own job coverage measure derived from usage data (red area).
The red area, depicting LLM use from the Anthropic Economic Index, shows how people are using Claude in professional settings. The coverage shows AI is far from reaching its theoretical capabilities. For instance, Claude currently covers just 33% of all tasks in the Computer & Math category.
As capabilities advance, adoption spreads, and deployment deepens, the red area will grow to cover the blue. There is a large uncovered area too; many tasks, of course, remain beyond AI's reach—from physical agricultural work like pruning trees and operating farm machinery to legal tasks like representing clients in court.
Figure 3 shows the ten occupations most exposed under this measure. In line with other data showing that Claude is extensively used for coding, Computer Programmers are at the top, with 75% coverage, followed by Customer Service Representatives, whose main tasks we increasingly see in first-party API traffic. Finally, Data Entry Keyers, whose primary task of reading source documents and entering data sees significant automation, are 67% covered.
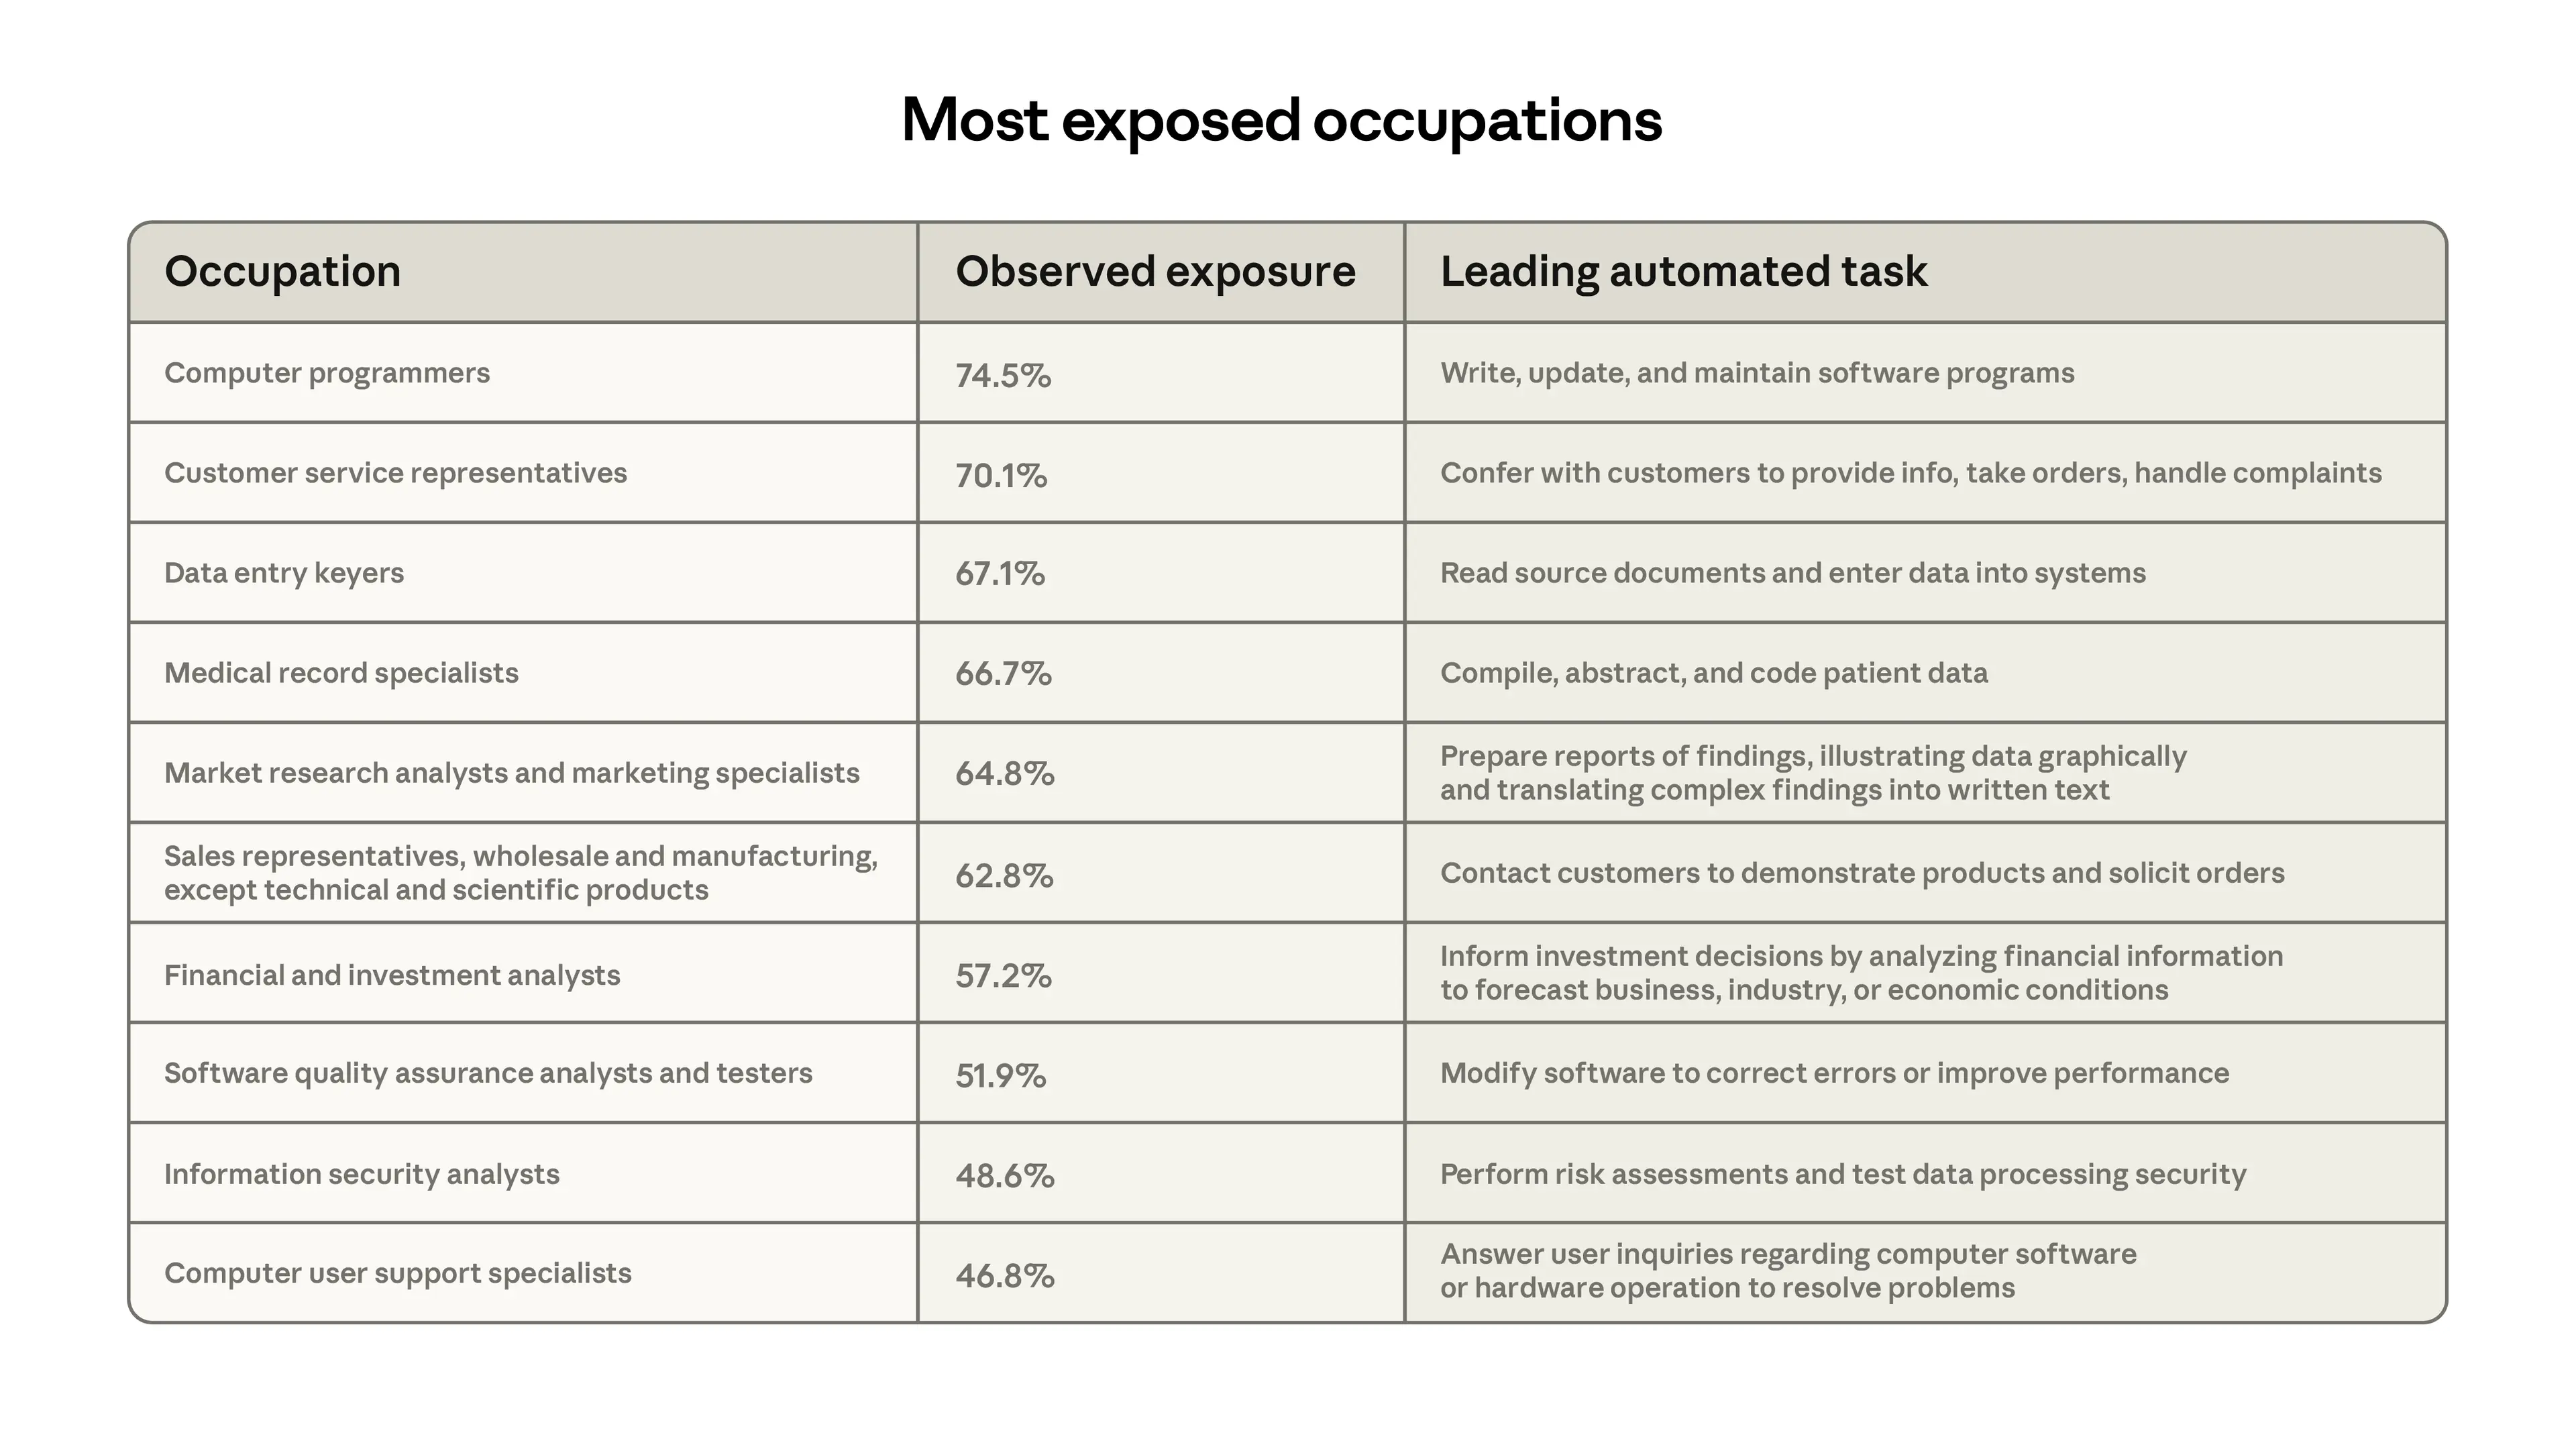
At the bottom end, 30% of workers have zero coverage, as their tasks appeared too infrequently in our data to meet the minimum threshold. This group includes, for example, Cooks, Motorcycle Mechanics, Lifeguards, Bartenders, Dishwashers, and Dressing Room Attendants.
How exposure tracks with projected job growth and worker characteristics
The US Bureau of Labor Statistics (BLS) publishes regular employment projections, with the latest set, published in 2025, covering predicted changes in employment for every occupation from 2024 to 2034. In Figure 4, we compare our job-level coverage measure to their predictions.
A regression at the occupation level weighted by current employment finds that growth projections are somewhat weaker for jobs with more observed exposure. For every 10 percentage point increase in coverage, the BLS’s growth projection drops by 0.6 percentage points. This provides some validation in that our measures track the independently derived estimates from labor market analysts, although the relationship is slight. Interestingly, there is no such correlation using the Eloundou et al. measure alone.
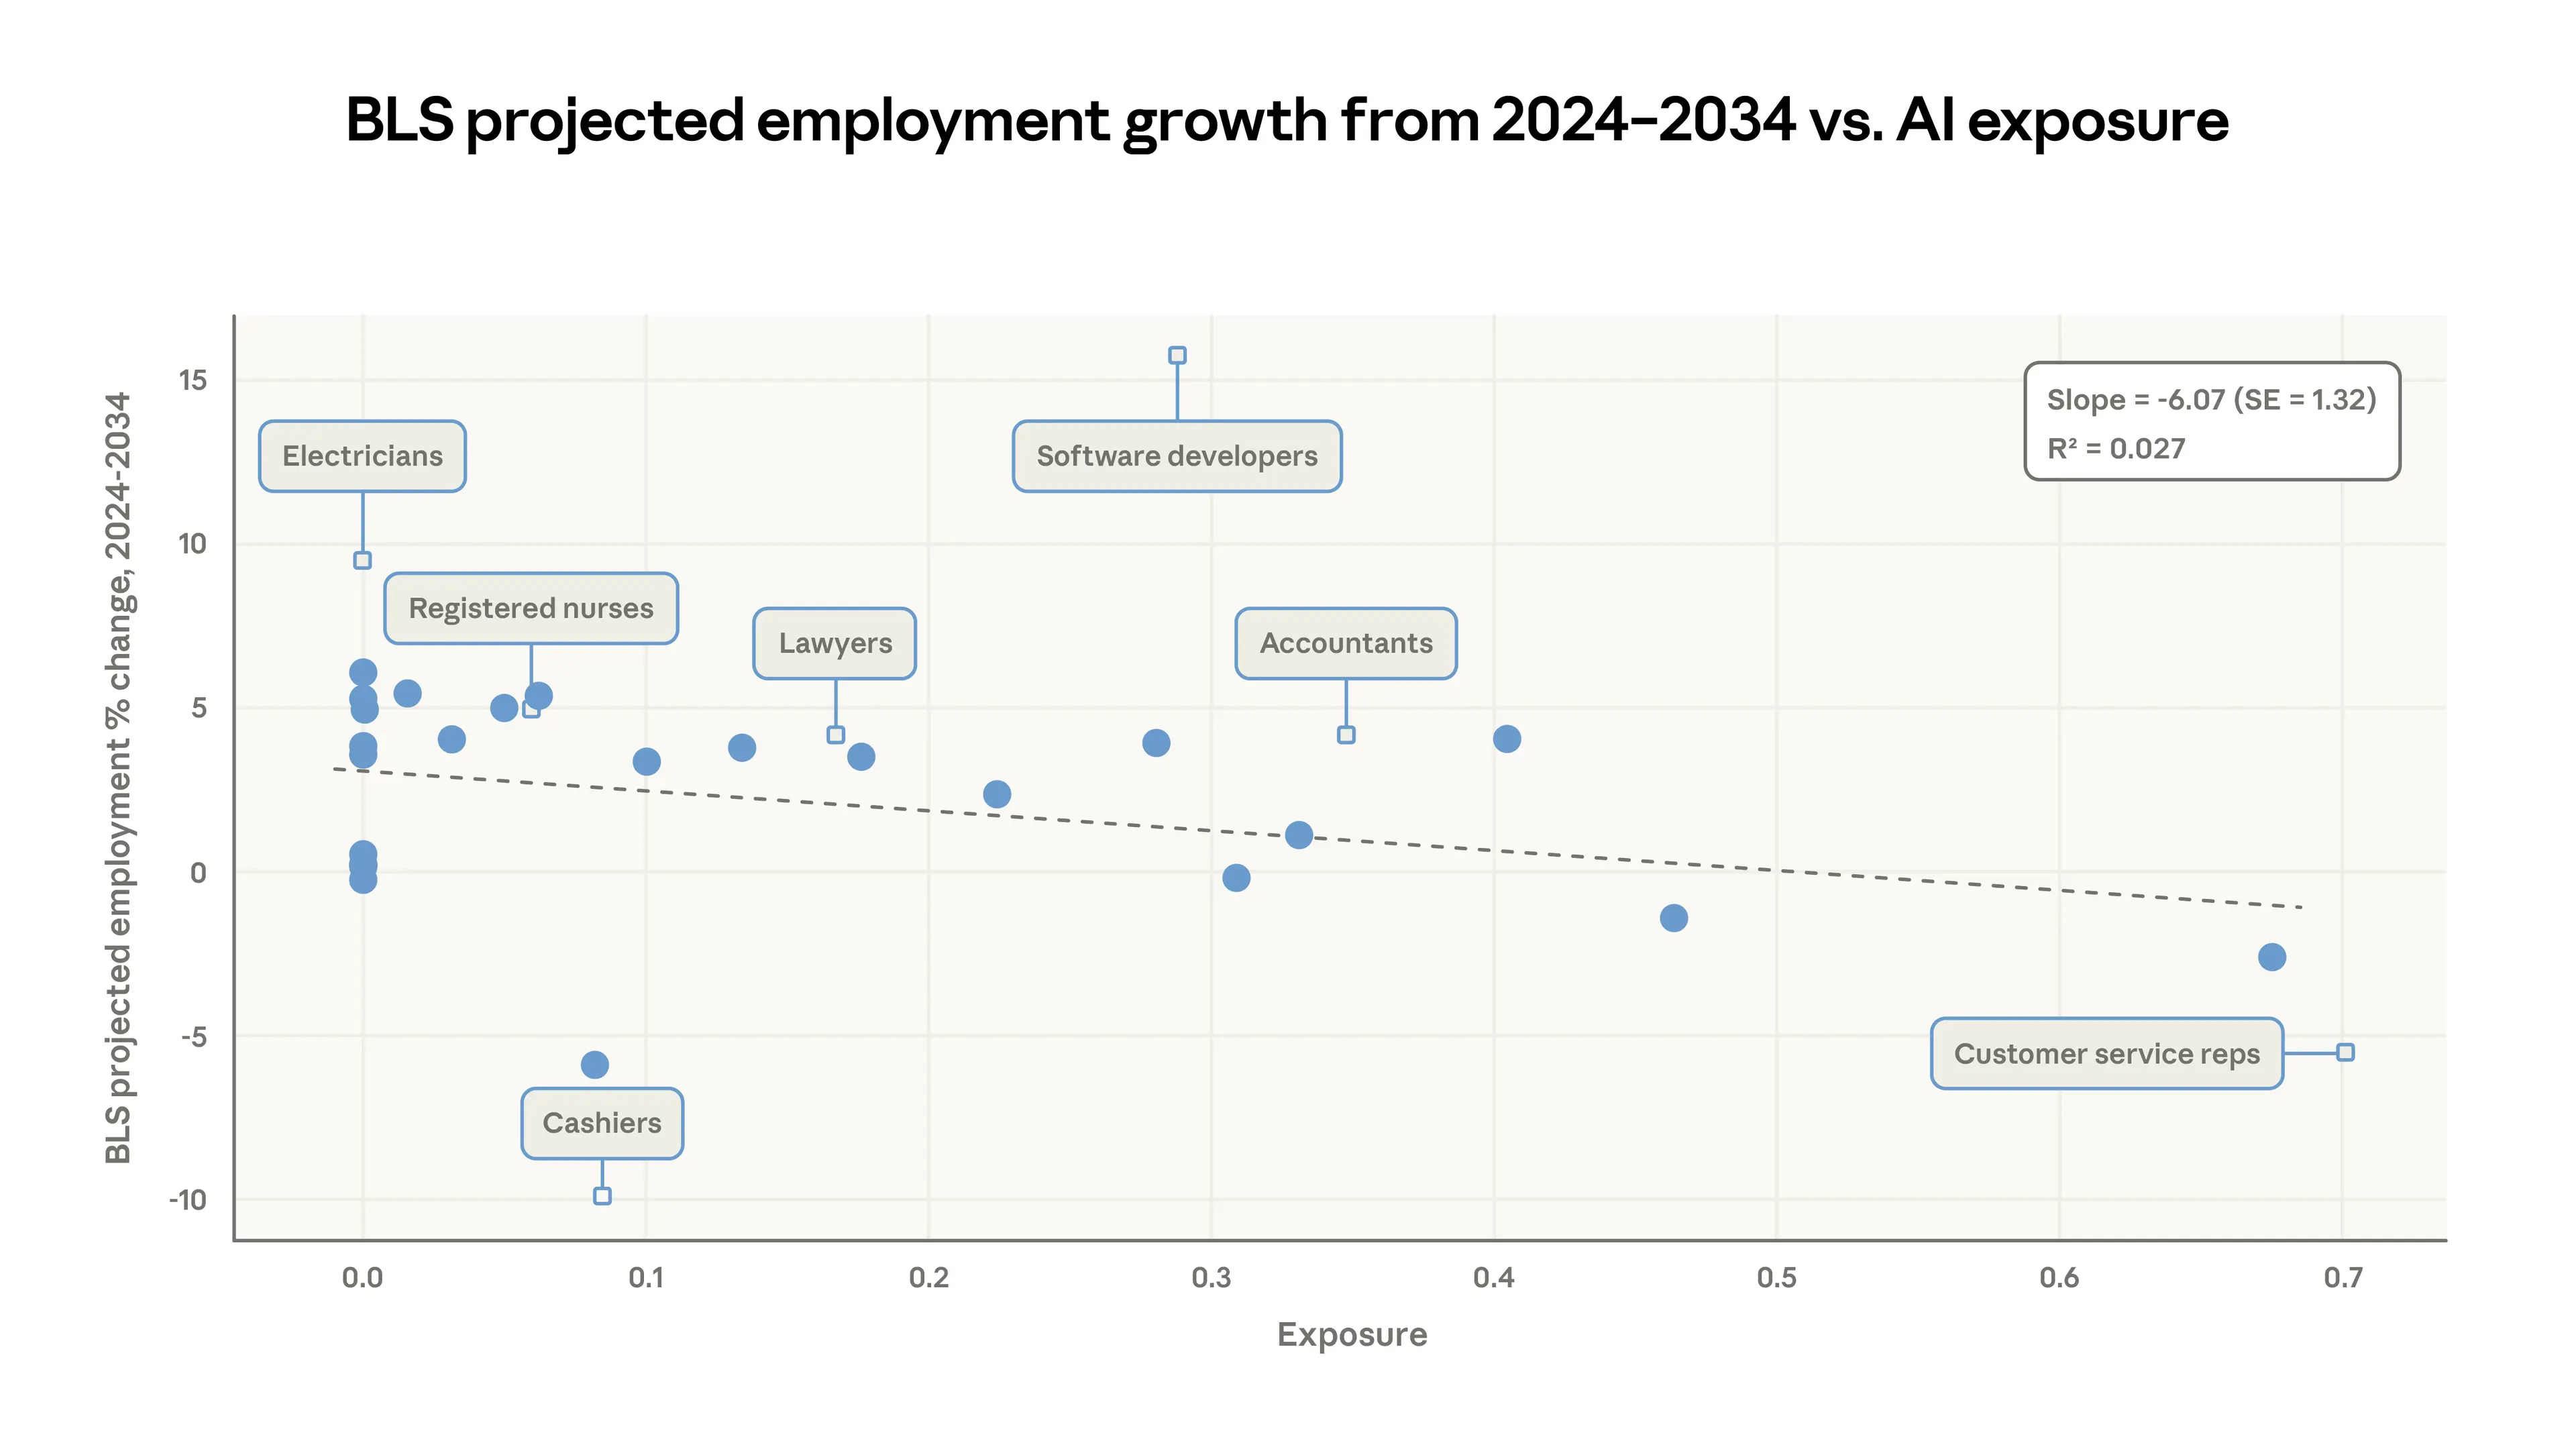
Binned scatterplot with 25 equally-sized bins. Each solid dot shows the average observed exposure and projected employment change for one of the bins. The dashed line shows a simple linear regression fit, weighted by current employment levels. The small diamonds mark individual example occupations for illustration.
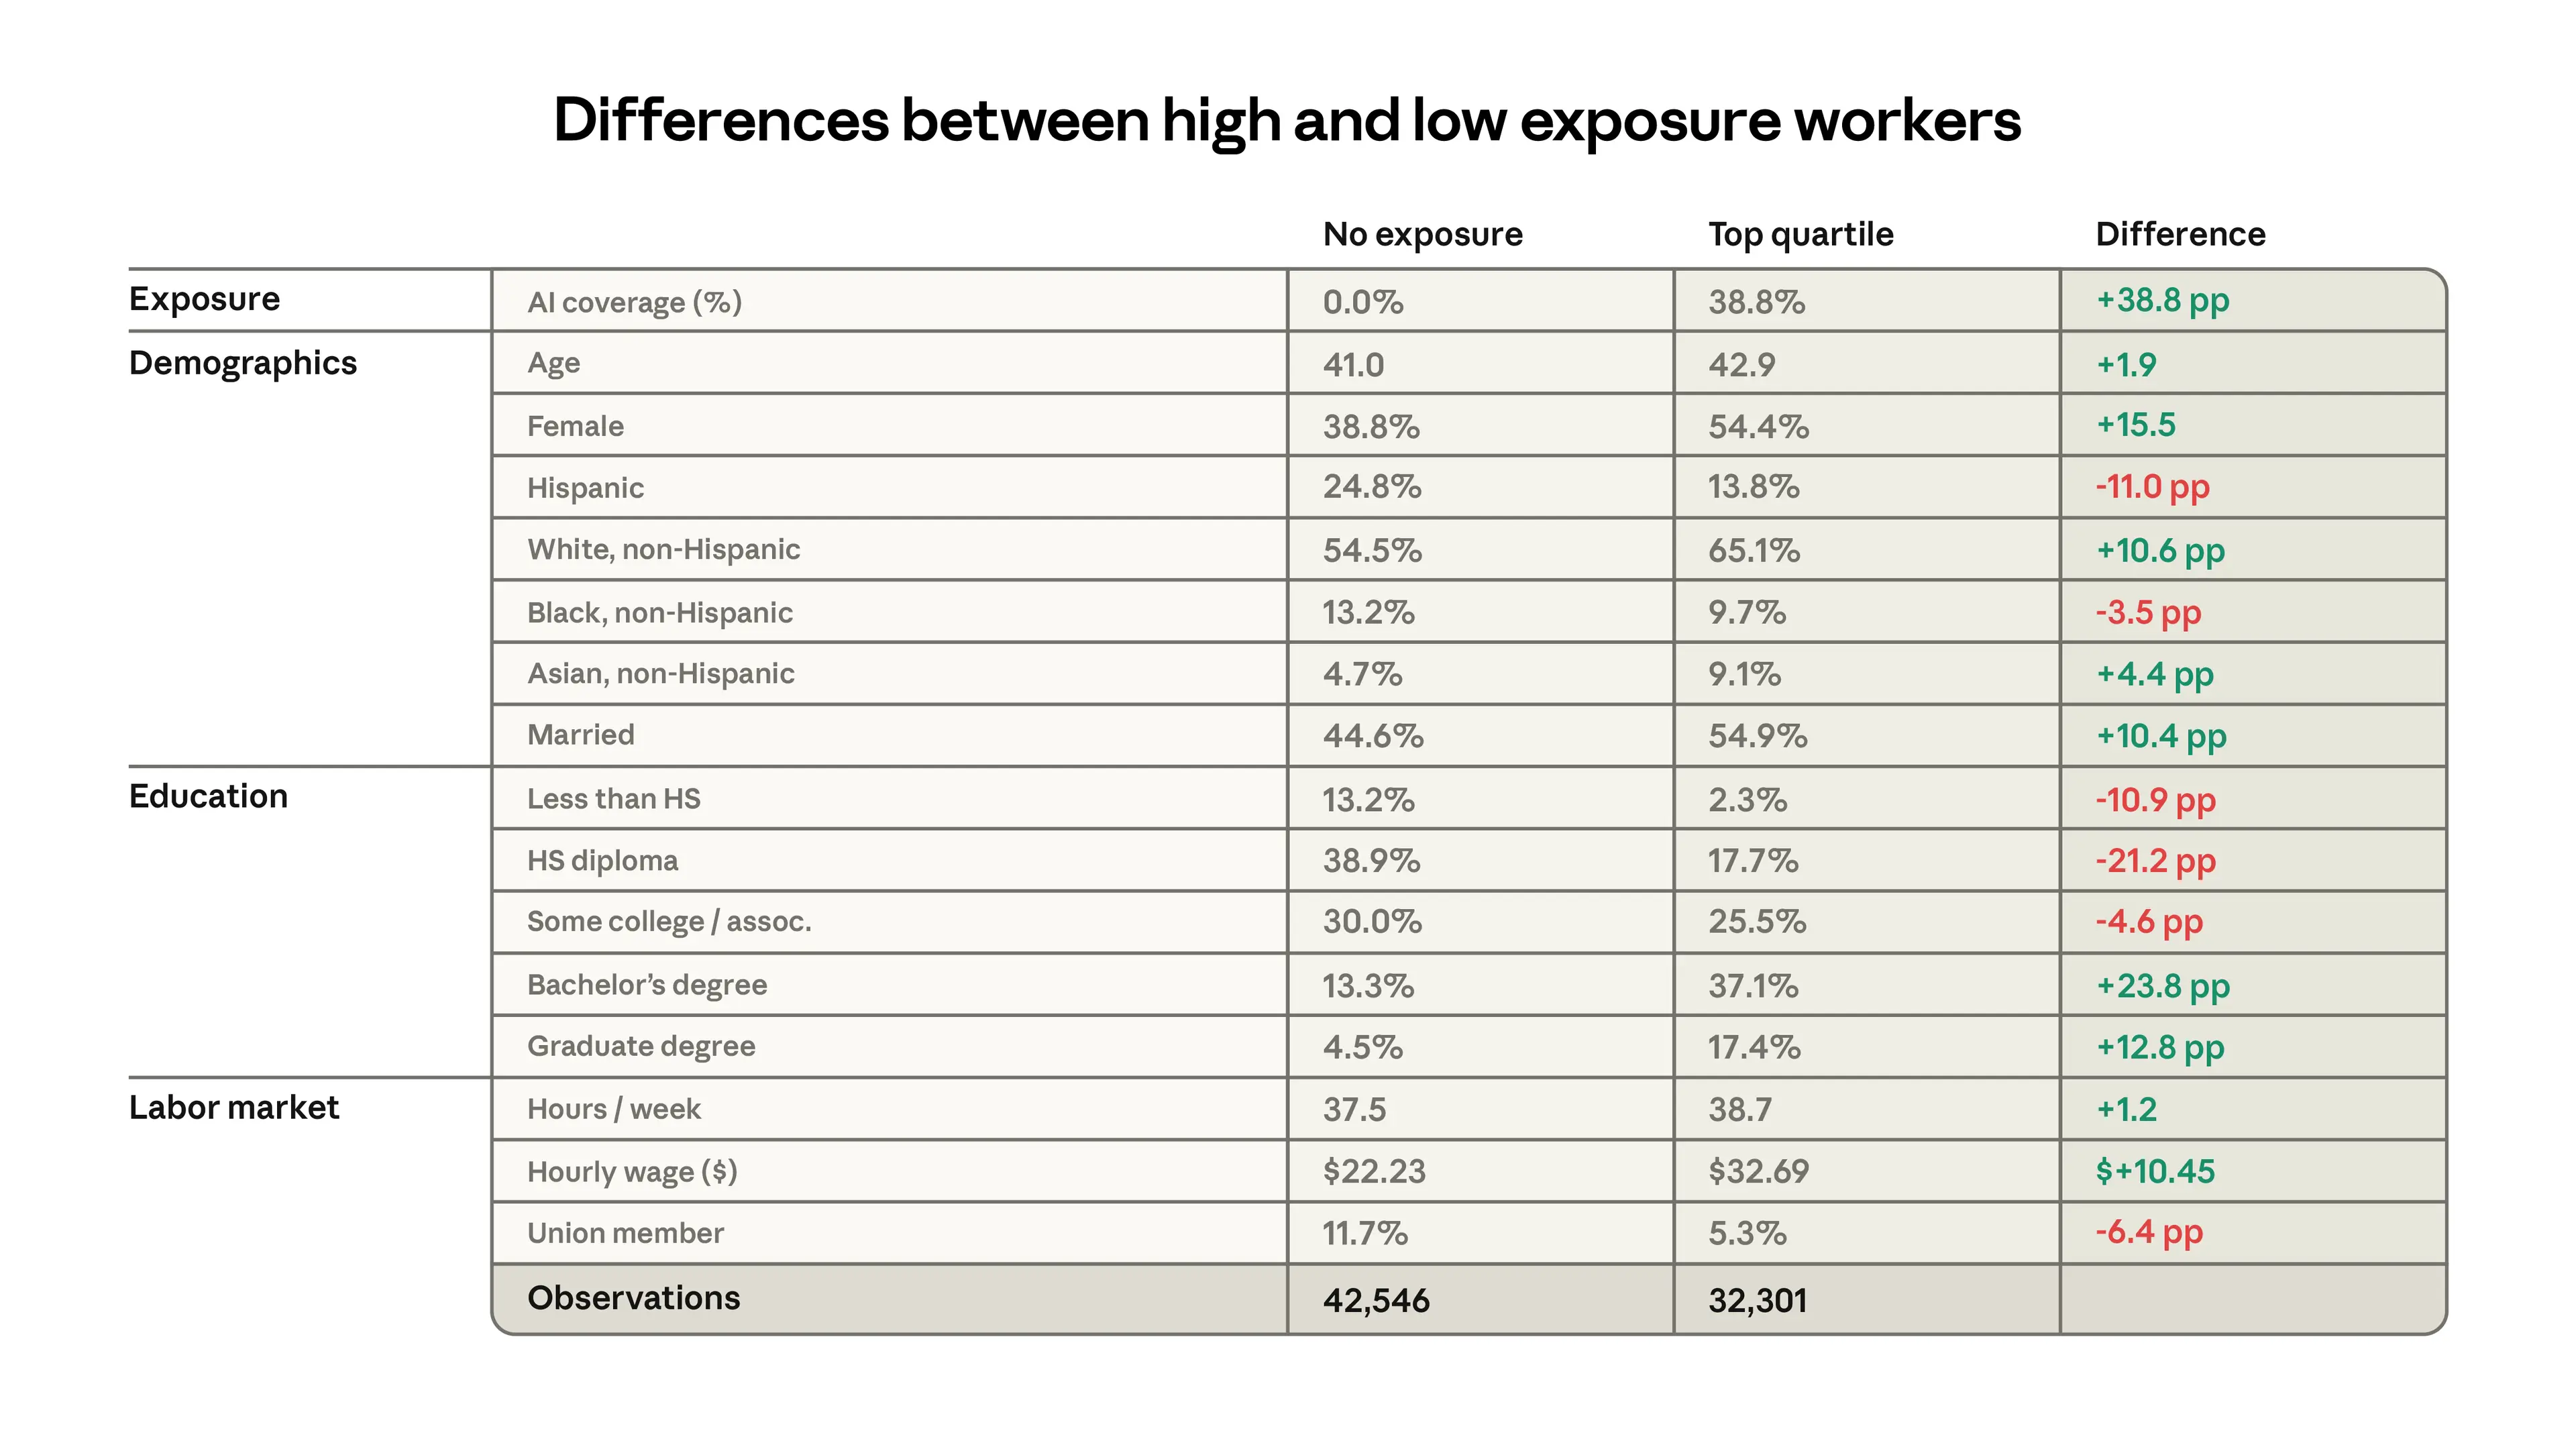
Figure 5 shows characteristics of workers in the top quartile of exposure and the 30% of workers with zero exposure in the three months before ChatGPT was released, August to October 2022, using data from the Current Population Survey.7 The groups are very different. The more exposed group is 16 percentage points more likely to be female, 11 percentage points more likely to be white, and almost twice as likely to be Asian. They earn 47% more, on average, and have higher levels of education. For example, people with graduate degrees are 4.5% of the unexposed group, but 17.4% of the most exposed group, an almost fourfold difference.
Prioritizing outcomes
With these exposure measures in hand, the question is what to look for. Researchers have taken different approaches. For example, Gimbel et al. (2025) track changes in the occupational mix using the Current Population Survey. Their argument is that any important restructuring of the economy from AI would show up as changes in distribution of jobs.¹ (They find that, so far, changes have been unremarkable.) Brynjolfsson et al. (2025) look at employment levels split by age group using data from the payroll processing firm ADP, while Acemoglu et al. (2022) and Hampole et al. (2025) use job posting data from Burning Glass (now Lightcast) and Revelio, respectively.
We focus on unemployment as our priority outcome because it most directly captures the potential for economic harm—a worker who is unemployed wants a job and has not yet found one. In this case, job postings and employment do not necessarily signal the need for policy responses; a decline in job postings for a highly exposed role may be counteracted by increased openings in a related one. Most harmful labor market developments of AI should arguably include a period of increased unemployment, as displaced workers search for alternatives. The Current Population Survey is well suited to tracking this, as unemployed respondents report their previous job and industry.
Initial results
We next study trends in unemployment, matching our occupation-level measures to respondents in the Current Population Survey.
A key question in interpreting our coverage measure is which workers should be considered treated? Should changes in employment be expected from just 10% task coverage? Gans and Goldfarb (2025) show that if an O-ring model best describes jobs, employment effects might be seen only when all tasks have some degree of AI penetration. Hampole et al. (2025) argue that mean exposure decreases labor demand, but concentration of exposure in only certain tasks can counteract this. And Autor and Thompson (2025) highlight the level of expertise required for the remaining tasks.
With an eye toward simplicity, and noting that we are most concerned with large impacts, we center our analysis on the idea that impacts should be felt most in the groups with the highest mean exposure. We compare workers in the top quartile of time-weighted task coverage to those in the bottom. If AI capabilities advance quickly, task coverage might be high for lower percentiles of coverage, which might make an absolute threshold more helpful. But we make the assumption that impacts should affect the most exposed workers first, and present results varying the cutoff we use to define treatment.
The upper panel of Figure 6 shows raw trends in the unemployment rate since 2016 for workers in the top quartile of exposure and the unexposed group. During COVID, the less AI-exposed workers—who are more likely to have in-person jobs—saw a much larger increase in unemployment. Since then, the trends have been largely similar between the two groups. The lower panel measures the size of the gap between the most and least exposed workers in a difference-in-differences framework, mirroring the findings from the raw data. The average change in the gap since the release of ChatGPT is small and insignificant, suggesting that the unemployment rate of the more exposed group has increased slightly but the effect is indistinguishable from zero.8
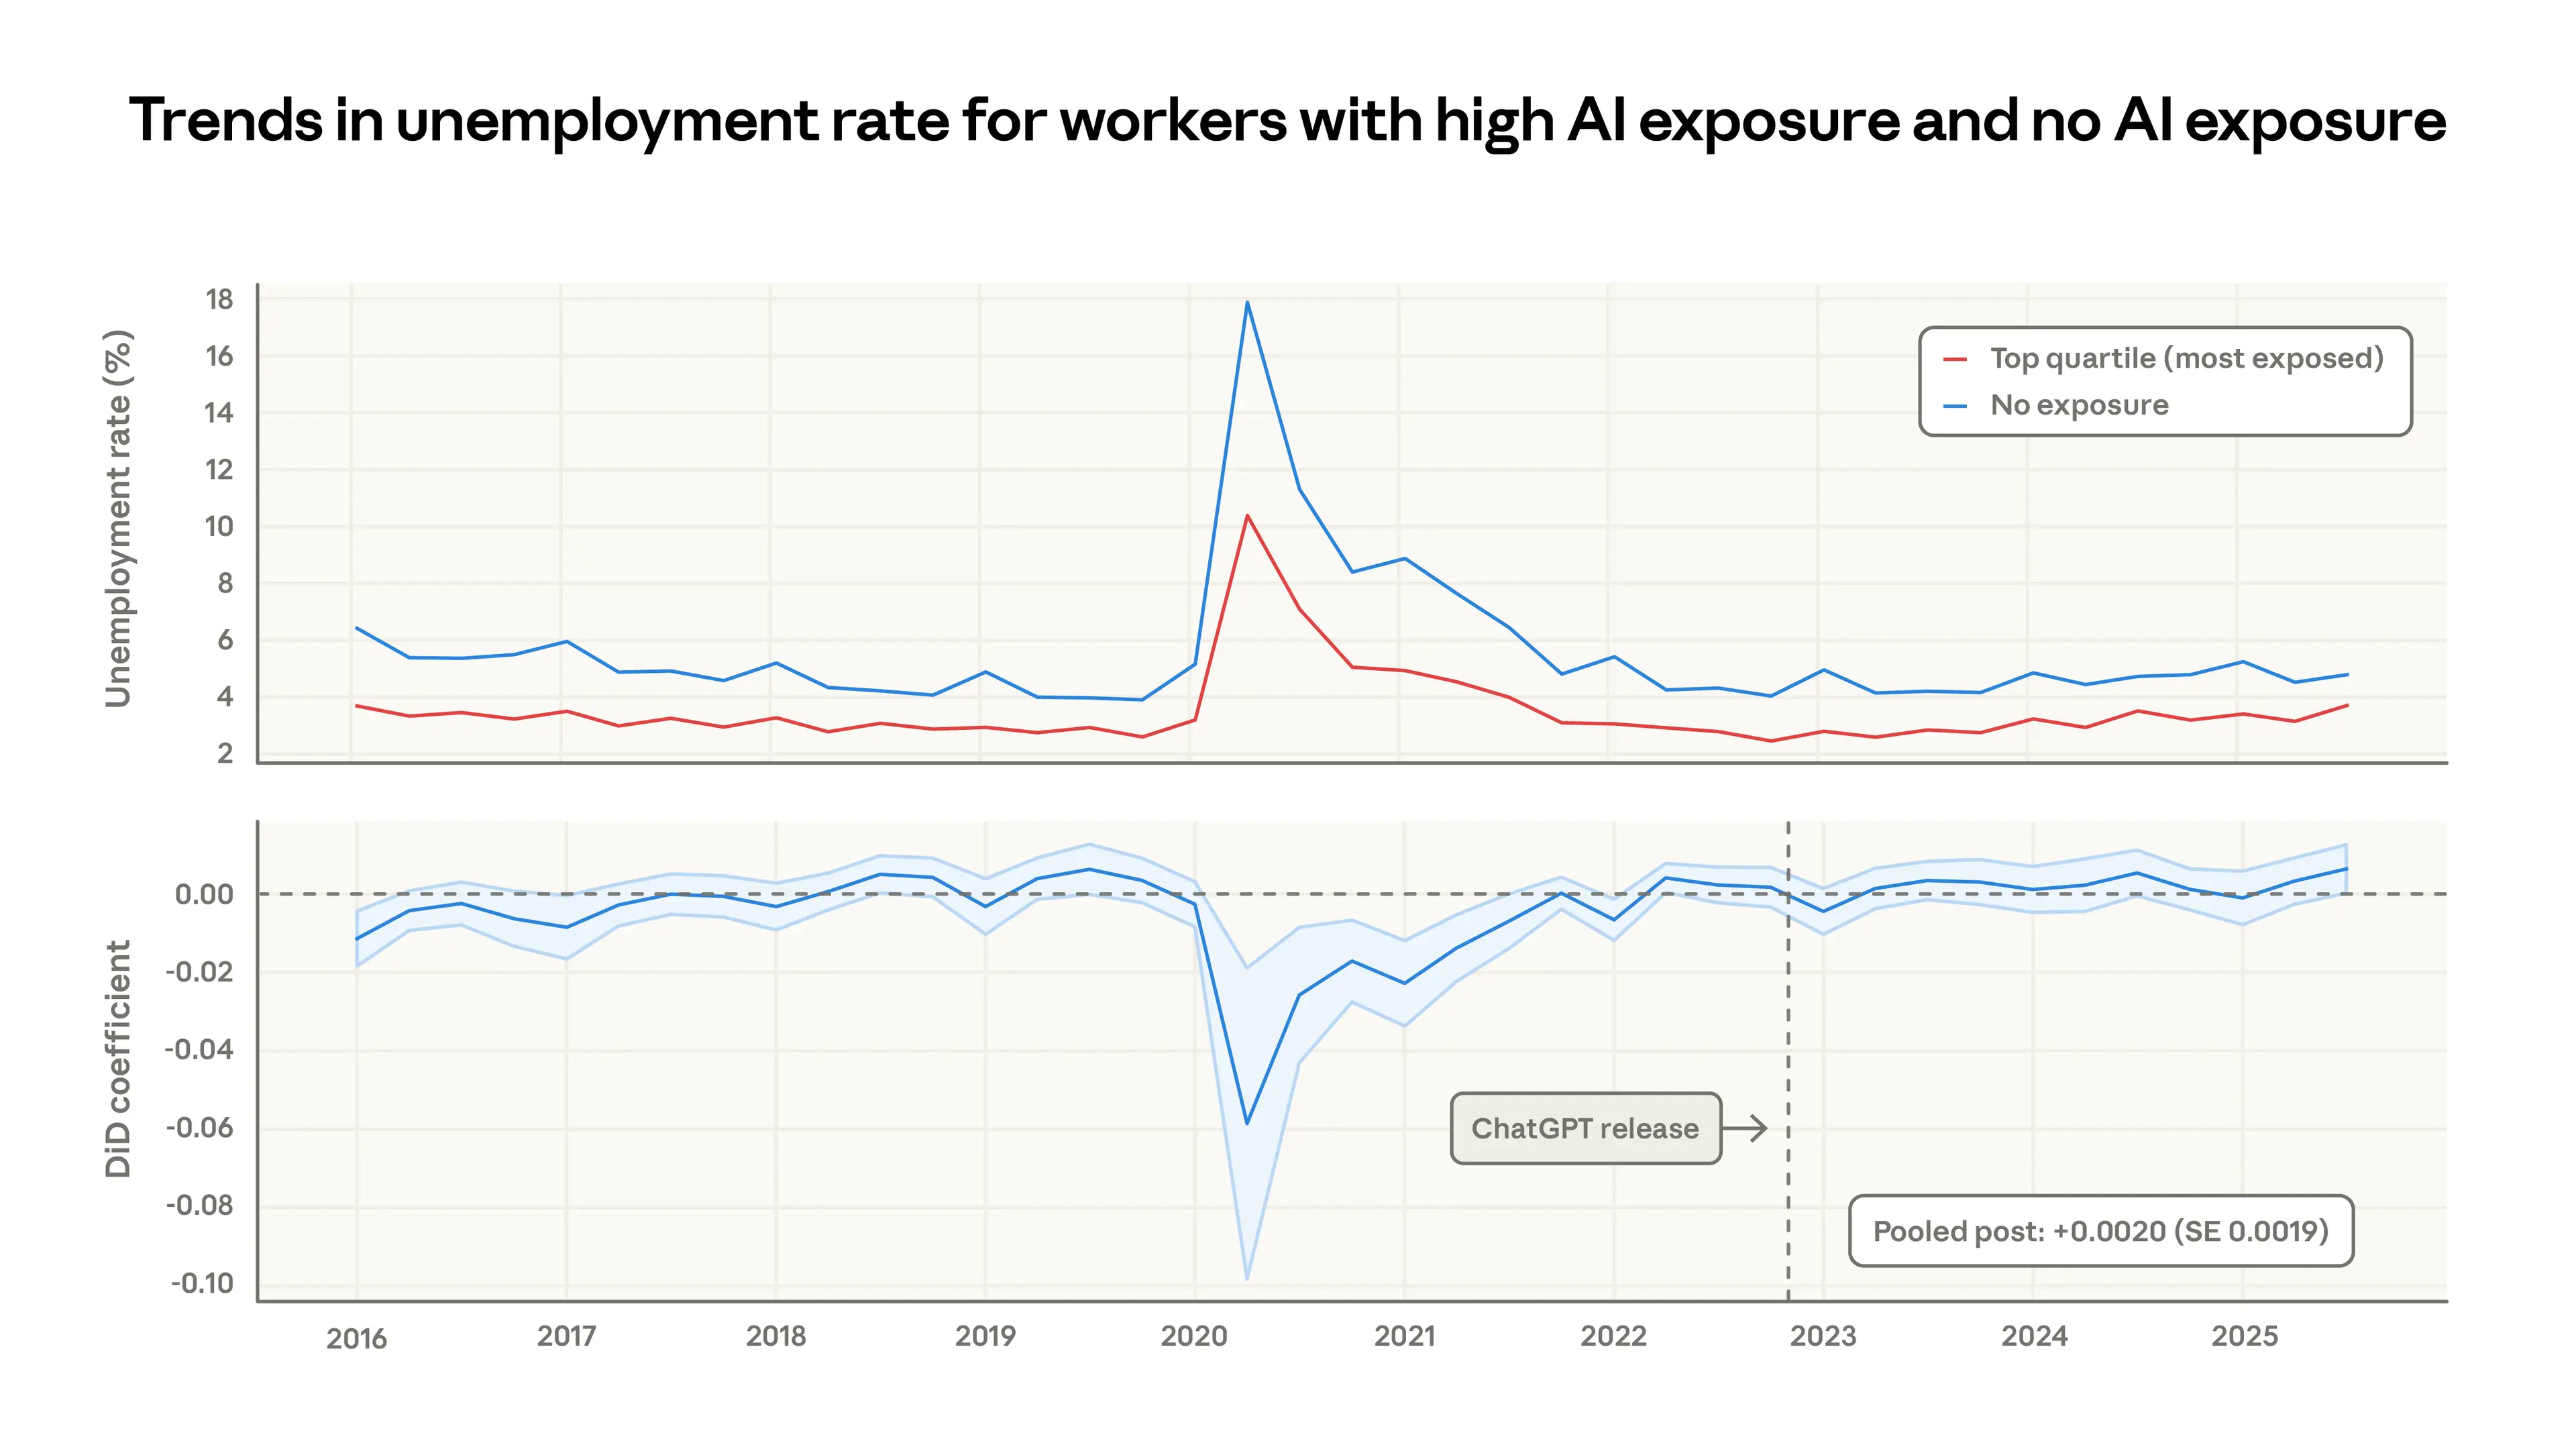
The top panel shows the unemployment rate for workers in the top quartile of exposure (red line) and the 30% of workers with zero exposure. The bottom panel measures the gap between these two series in a difference-in-differences framework.
What kind of scenarios can this framework identify? Based on the confidence interval of the pooled estimate, differential increases in unemployment on the order of 1 percentage point would be detectable (this will change as new data comes in, so it is merely a ballpark estimate). If all workers within the top 10% were laid off, it would increase unemployment within the top quartile group from 3% to 43%, and it would increase aggregate unemployment from 4% to 13%.
A smaller but still concerning impact would be a scenario such as a “Great Recession for white-collar workers.” During the 2007-2009 Great Recession, unemployment rates doubled from 5% to 10% in the US. Such a doubling in the top quartile of exposure would increase its unemployment rate from 3% to 6%. This should be visible in our analysis as well. Note that our core estimate is based on differential changes in the unemployment rate in the exposed group compared to the less exposed group. If unemployment increased for all workers in parallel, we would not attribute this to AI advancements that still leave many tasks unaffected.
One group of particular concern is young workers. Brynjolfsson et al. report a 6—16% fall in employment in exposed occupations among workers aged 22 to 25. They attribute this decrease primarily to a slowdown in hiring rather than an increase in separations.9
We find that the unemployment rate for young workers in the exposed occupations is flat (see Appendix). But slowed hiring may not necessarily manifest as increased unemployment, since many young workers are labor market entrants without a listed occupation in the CPS data and may exit the labor force rather than appear as unemployed. To address hiring directly, we use the panel dimension of the CPS, counting the percent of young (22-25 year old) workers who begin a new job in a more vs. less exposed occupation over time. Figure 7 shows the monthly job finding rate (i.e., when a worker reports a job that they did not have in the previous month) for young workers, split by whether they are entering a high- vs. low-exposure occupation.
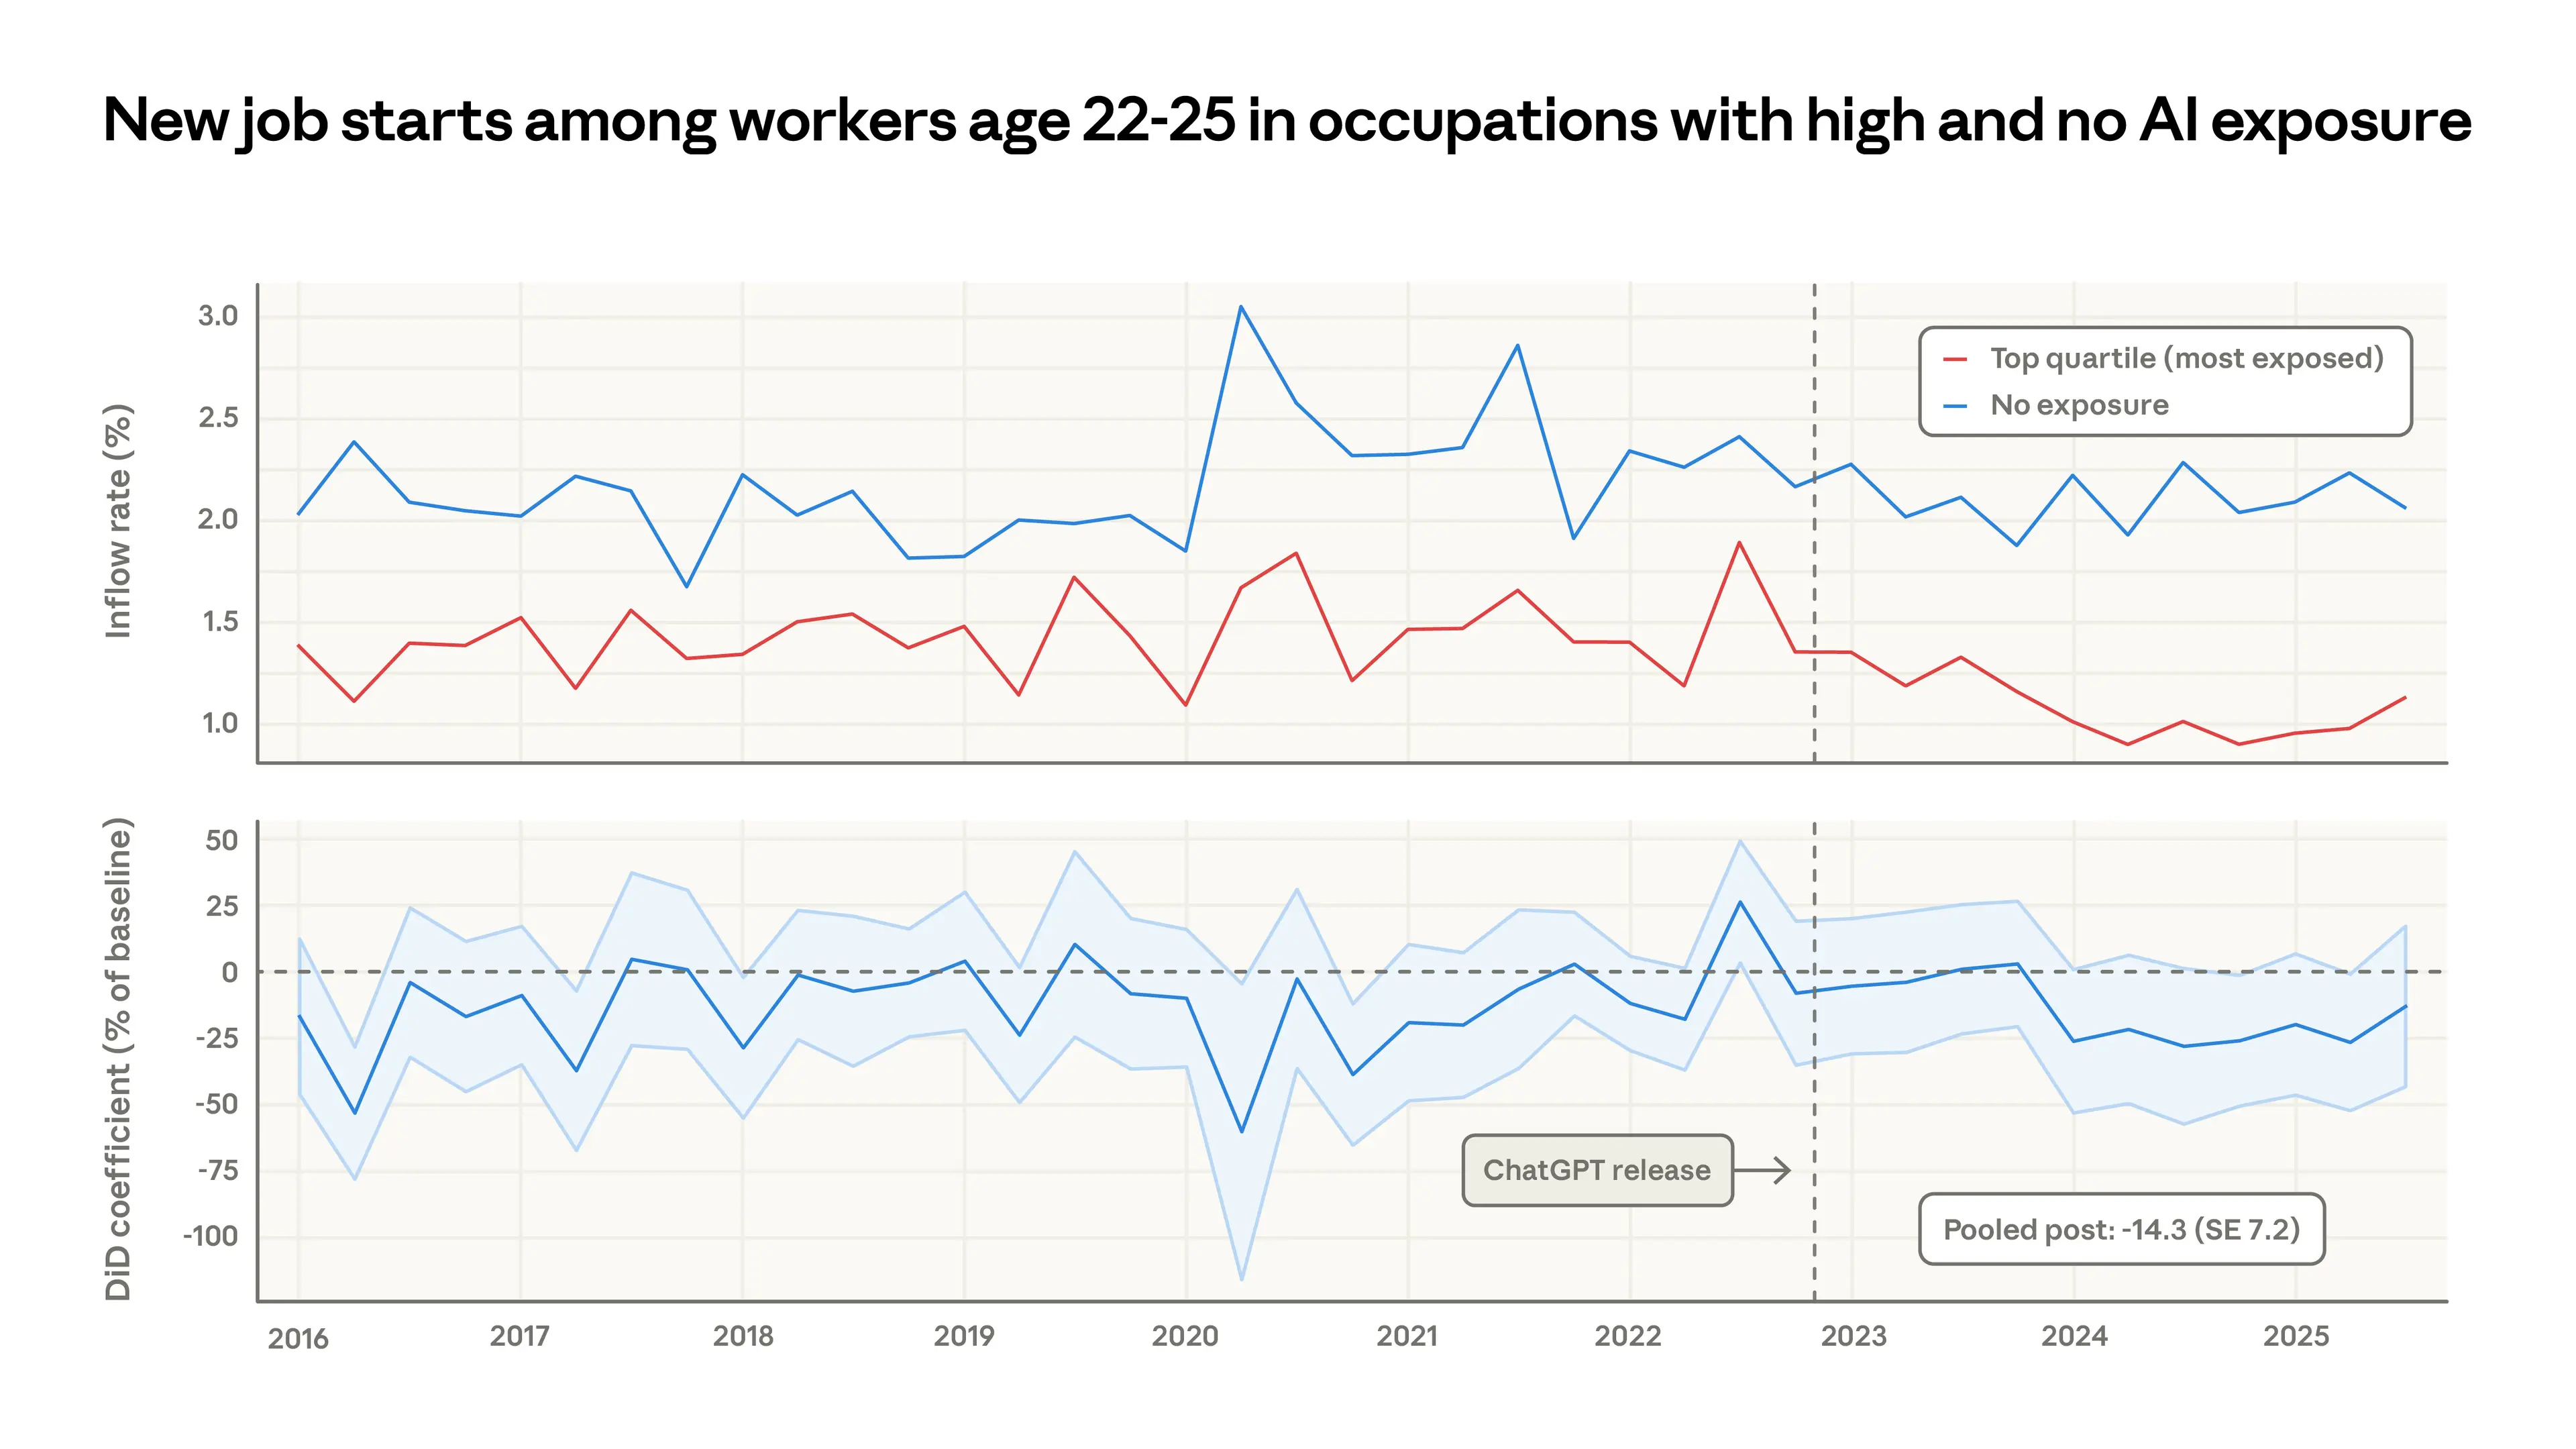
The top panel shows the percent of young workers starting new jobs in high vs. no exposure occupations. The bottom panel measures the gap between these two series in a difference-in-differences framework.
Apart from some large swings in 2020-2021, these series visually diverge in 2024, with young workers relatively less likely to be hired into exposed occupations. Job finding rates at the less exposed occupations remain stable at 2% per month, while entry into the most exposed jobs decreases by about half a percentage point. The averaged estimate in the post-ChatGPT era is a 14% drop in the job finding rate compared to that in 2022 in the exposed occupations, although this is just barely statistically significant. (There is no such decrease for workers older than 25.)
This may provide some signal of the early effects of AI on employment, and echoes the findings from Brynjolfsson et al. But there are several alternative interpretations. The young workers who are not hired may be remaining at their existing jobs, taking different jobs, or returning to school. A further data-related caveat is that job transitions may be more vulnerable to mismeasurement in surveys.10
Discussion
This report introduces a new measure for understanding the labor market effects of AI and studies impacts on unemployment and hiring. Jobs are more exposed to AI to the extent that their tasks are theoretically feasible with LLMs and observed on our platforms in automated, work-related use cases. We find that computer programmers, customer service representatives, and financial analysts are among the most exposed. Using survey data from the US, we find no impact on unemployment rates for workers in the most exposed occupations, although there’s tentative evidence that hiring into those professions has slowed slightly for workers aged 22-25.
Our work is a first step toward cataloging the impact of AI on the labor market. We hope that the analytical steps taken in this report, especially around coverage and counterfactuals, will be easy to update as new data on employment and AI usage emerge. An established approach may help future observers separate signal from noise.
There are several improvements to be made to the present work. Our usage data will be incorporated in future updates, forming an evolving picture of task and job coverage in the economy. The Eloundou et al. metric could also be updated, to the extent that it is linked to LLM capabilities as of early 2023. And, given the suggestive results around young workers and labor market entrants, a key next step might be to look at how recent graduates with educational credentials in exposed areas are navigating the labor market.
Appendix
Available here.
Acknowledgements
Written by Maxim Massenkoff and Peter McCrory.
With acknowledgements to: Ruth Appel, Tim Belonax, Keir Bradwell, Andy Braden, Dexter Callender III, Miriam Chaum, Madison Clark, Jake Eaton, Deep Ganguli, Kunal Handa, Ryan Heller, Lara Karadogan, Jennifer Martinez, Jared Mueller, Sarah Pollack, David Saunders, Carl De Torres, Kim Withee, and Jack Clark.
We additionally thank Martha Gimbel, Anders Humlum, Evan Rose, and Nathan Wilmers for feedback on earlier versions of this report.
Citation
@online{massenkoffmccrory2026labor,
 author = {Maxim Massenkoff and Peter McCrory},
 title = {Labor market impacts of AI: A new measure and early evidence},
 date = {2026-03-05},
 year = {2026},
 url = {https://www.anthropic.com/research/labor-market-impacts},
}References
Acemoglu, Daron and Pascual Restrepo, "Robots and Jobs: Evidence from US Labor Markets," Journal of Political Economy, 2020, 128 (6), 2188–2244.
Acemoglu, Daron, David Autor, Jonathon Hazell, and Pascual Restrepo, "Artificial intelligence and jobs: Evidence from online vacancies," Journal of Labor Economics, 2022, 40 (S1), S293–S340.
Appel, Ruth, Maxim Massenkoff, Peter McCrory, Miles McCain, Ryan Heller, Tyler Neylon, and Alex Tamkin, "Anthropic Economic Index report: economic primitives," 2026.
Autor, David H, David Dorn, and Gordon H Hanson, "The China syndrome: Local labor market effects of import competition in the United States," American Economic Review, 2013, 103 (6), 2121–2168.
Autor, David H, & Thompson, N. (2025). Expertise. NBER Working Paper, (w33941).
Blinder, Alan S et al., "How many US jobs might be offshorable?," World Economics, 2009, 10 (2), 41.
Borusyak, Kirill, Peter Hull, and Xavier Jaravel, "Quasi-experimental shift-share research designs," The Review of Economic Studies, 2022, 89 (1), 181–213.
Brynjolfsson, Erik, Bharat Chandar, and Ruyu Chen, "Canaries in the coal mine? six facts about the recent employment effects of artificial intelligence," Digital Economy, 2025.
Eckhardt, Sarah and Nathan Goldschlag, "AI and Jobs: The Final Word (Until the Next One)," Economic Innovation Group (EIG), August 2025. Available at: https://eig.org/ai-and-jobs-the-final-word/
Eloundou, Tyna, Sam Manning, Pamela Mishkin, and Daniel Rock, "Gpts are gpts: An early look at the labor market impact potential of large language models," arXiv preprint arXiv:2303.10130, 2023, 10.
Fujita, S., Moscarini, G., & Postel-Vinay, F. (2024). Measuring employer-to-employer reallocation. American Economic Journal: Macroeconomics, 16(3), 1-51.
Gans, Joshua S. and Goldfarb, Avi, "O-Ring Automation," NBER Working Paper No. 34639, December 2025. Available at SSRN: https://ssrn.com/abstract=5962594
Gimbel, Martha, Molly Kinder, Joshua Kendall, and Maddie Lee, "Evaluating the Impact of AI on the Labor Market: Current State of Affairs," Research Report, The Budget Lab at Yale, New Haven, CT October 2025. Available at: https://budgetlab.yale.edu.
Graetz, Georg and Guy Michaels, "Robots at Work," Review of Economics and Statistics, 2018, 100 (5), 753–768.
Hampole, Menaka, Dimitris Papanikolaou, Lawrence DW Schmidt, and Bryan Seegmiller, "Artificial intelligence and the labor market," Technical Report, National Bureau of Economic Research 2025.
Handa, Kunal, Alex Tamkin, Miles McCain, Saffron Huang, Esin Durmus, Sarah Heck, Jared Mueller, Jerry Hong, Stuart Ritchie, Tim Belonax, Kevin K. Troy, Dario Amodei, Jared Kaplan, Jack Clark, and Deep Ganguli, "Which Economic Tasks are Performed with AI? Evidence from Millions of Claude Conversations," 2025.
Hui, Xiang, Oren Reshef, and Luofeng Zhou, "The short-term effects of generative artificial intelligence on employment: Evidence from an online labor market," Organization Science, 2024, 35 (6), 1977–1989.
Johnston, Andrew and Christos Makridis, "The labor market effects of generative AI: A difference-in-differences analysis of AI exposure," Available at SSRN 5375017, 2025.
Massenkoff, Maxim, "How predictable is job destruction? Evidence from the Occupational Outlook," 2025. Working Paper.
Ozimek, Adam, "Overboard on Offshore Fears," 2019. https://papers.ssrn.com/sol3/papers.cfm?abstract_id=3777307
Tamkin, Alex and Peter McCrory, "Estimating AI productivity gains from Claude conversations," 2025.
Tomlinson, K., Jaffe, S., Wang, W., Counts, S., & Suri, S. (2025). Working with AI: measuring the applicability of generative AI to occupations. arXiv preprint arXiv:2507.07935.
Footnotes
Job offshorability: Blinder et al. (2009) and Ozimek (2019); Government growth forecasts: Massenkoff (2025); Robots: Graetz and Michaels (2018) and Acemoglu and Restrepo (2020); China shock: Autor et al. (2013) and Borusyak et al. (2022).
Brynjolfsson et al. (2025) compare employment trends for workers in more versus less AI-exposed occupations, using the task exposure measures from Eloundou et al. (2023) and payroll data from ADP. Johnston and Makridis (2025) do a similar task-based analysis using US administrative data, but they aggregate treatment to the industry level. Hui et al. (2024) study how freelance jobs on Upwork responded to the release of ChatGPT and advanced image generation tools, comparing workers in directly affected categories to those in unaffected categories before and after each tool's release date. Hampole et al. (2025) instrument for firm-level AI adoption using historical university hiring networks: firms that historically recruited from universities whose graduates later entered AI-related roles faced lower adoption costs.
Our task- and occupation-level exposure measures can readily incorporate other usage data, and be extended to different countries. We intend to apply this methodology to new settings over time.
In their framework, “Directly exposed'” tasks were those that could be completed in half the time with an LLM (with a 2,000-word input limit and no access to recent facts). Tasks that were “exposed with tools” were those subject to the same speedup with an LLM that had access to software for, e.g., information retrieval and image processing. Tasks that were not exposed could not have their duration reduced by 50% or more using an LLM.
We use the previous two Anthropic Economic Index datasets, covering usage from August and November 2025. For ONET tasks that are highly semantically similar, we split the counts across them.
There are judgment calls involved at every step. Should the Eloundou et al. (2023) measure enter as {0, 0.5, 1} or something else? What determines "significant" use? How do we handle tasks which seem very similar to those with high usage, but are too rare to have been picked up specifically in the sampling for the Economic Index? How much more should automation workflows count compared to augmentation? A reassuring finding which we expand on in the Appendix is that the Spearman (rank-rank) correlation of job exposure across many resolutions to these questions is exceedingly high.
To match O*NET-SOC codes to occ1990 codes in the CPS, we use the crosswalk provided by Eckhart and Goldschlag (2025).
We explore this further in three ways in the Appendix. First, we ask whether the percentile cutoff that we use to define treatment matters, varying it from the median to the 95th percentile. In all cases, the impact is flat or negative (meaning that unemployment decreases for the exposed group). Next, we focus on young workers in particular, those aged 22 to 25 as in Brynjolfsson et al. (2025). Finally, we use data on unemployment insurance claimants from the Department of Labor to measure the unemployment, rather than CPS survey responses. In no extension do we find clear impacts on exposed jobs.
This range is wide because the authors provide estimates against multiple counterfactuals. The 6 percentage point drop compares to a counterfactual of flat employment growth. The 16 percentage point estimate comes from a design comparing similar workers in the same firm with different occupations.
See Fujita, et al. (2024).
Corrections
Updated Mar 8, 2026: Corrected Figure 7, which incorrectly reversed the labels between top quartile and zero exposure group inflow rates.
Related content
An update on our model deprecation commitments for Claude Opus 3
Read moreThe persona selection model
Read moreAnthropic Education Report: The AI Fluency Index
We tracked 11 observable behaviors across thousands of Claude.ai conversations to build the AI Fluency Index — a baseline for measuring how people collaborate with AI today.
Read more