Anthropic Economic Index: Tracking AI’s role in the US and global economy
Travel planning in Hawaii, scientific research in Massachusetts, and building web applications in India. On the face of it, these three activities share very little in common. But it turns out that they’re the particular uses of Claude that are some of the most overrepresented in each of these places.
That doesn’t mean these are the most popular tasks: software engineering is still by far in the lead in almost every state and country in the world. Instead, it means that people in Massachusetts have been more likely to ask Claude for help with scientific research than people elsewhere – or, for instance, that Claude users in Brazil appear to be particularly enthusiastic about languages: they use Claude for translation and language-learning about six times more than the global average.
These are statistics we found in our third Anthropic Economic Index report. In this latest installment, we’ve expanded our efforts to document the early patterns of AI adoption that are beginning to reshape work and the economy. We measure how Claude is being used differently…
- …within the US: we provide the first-ever detailed assessment of how AI use differs between US states. We find that the composition of states’ economies informs which states use Claude the most per capita – and, surprisingly, that the very highest-use states aren’t the ones where coding dominates.
- …across different countries: our new analysis finds that countries’ use of Claude is strongly correlated with income, and that people in lower-use countries use Claude to automate work more frequently than those in higher-use ones.
- …over time: we compare our latest data with December 2024-January 2025 and February–March 2025. We find that the proportion of ‘directively’ automated tasks increased sharply from 27% to 39%, suggesting a rapid increase in AI’s responsibility (and in users’ trust).
- …and by business users: we now include anonymized data from Anthropic’s first-party API customers (in addition to users of Claude.ai), allowing us to analyze businesses’ interactions for the first time. We find that API users are significantly more likely to automate tasks with Claude than consumers are, which suggests that major labor market implications could be on the horizon.
We summarize the report below. In addition, we’ve designed an interactive website where you can explore our data yourself. For the first time, you can search for trends and results in Claude.ai use across every US state and all occupations we track, to see how AI is used where you live or by people in similar jobs. Finally, if you’d like to build on our analysis, we’ve made our dataset openly available, alongside the data from our previous Economic Index reports.
Geography
We've expanded the Anthropic Economic Index to include geographic data. Below we cover what we've learned about how Claude is used across countries and US states.
Across countries
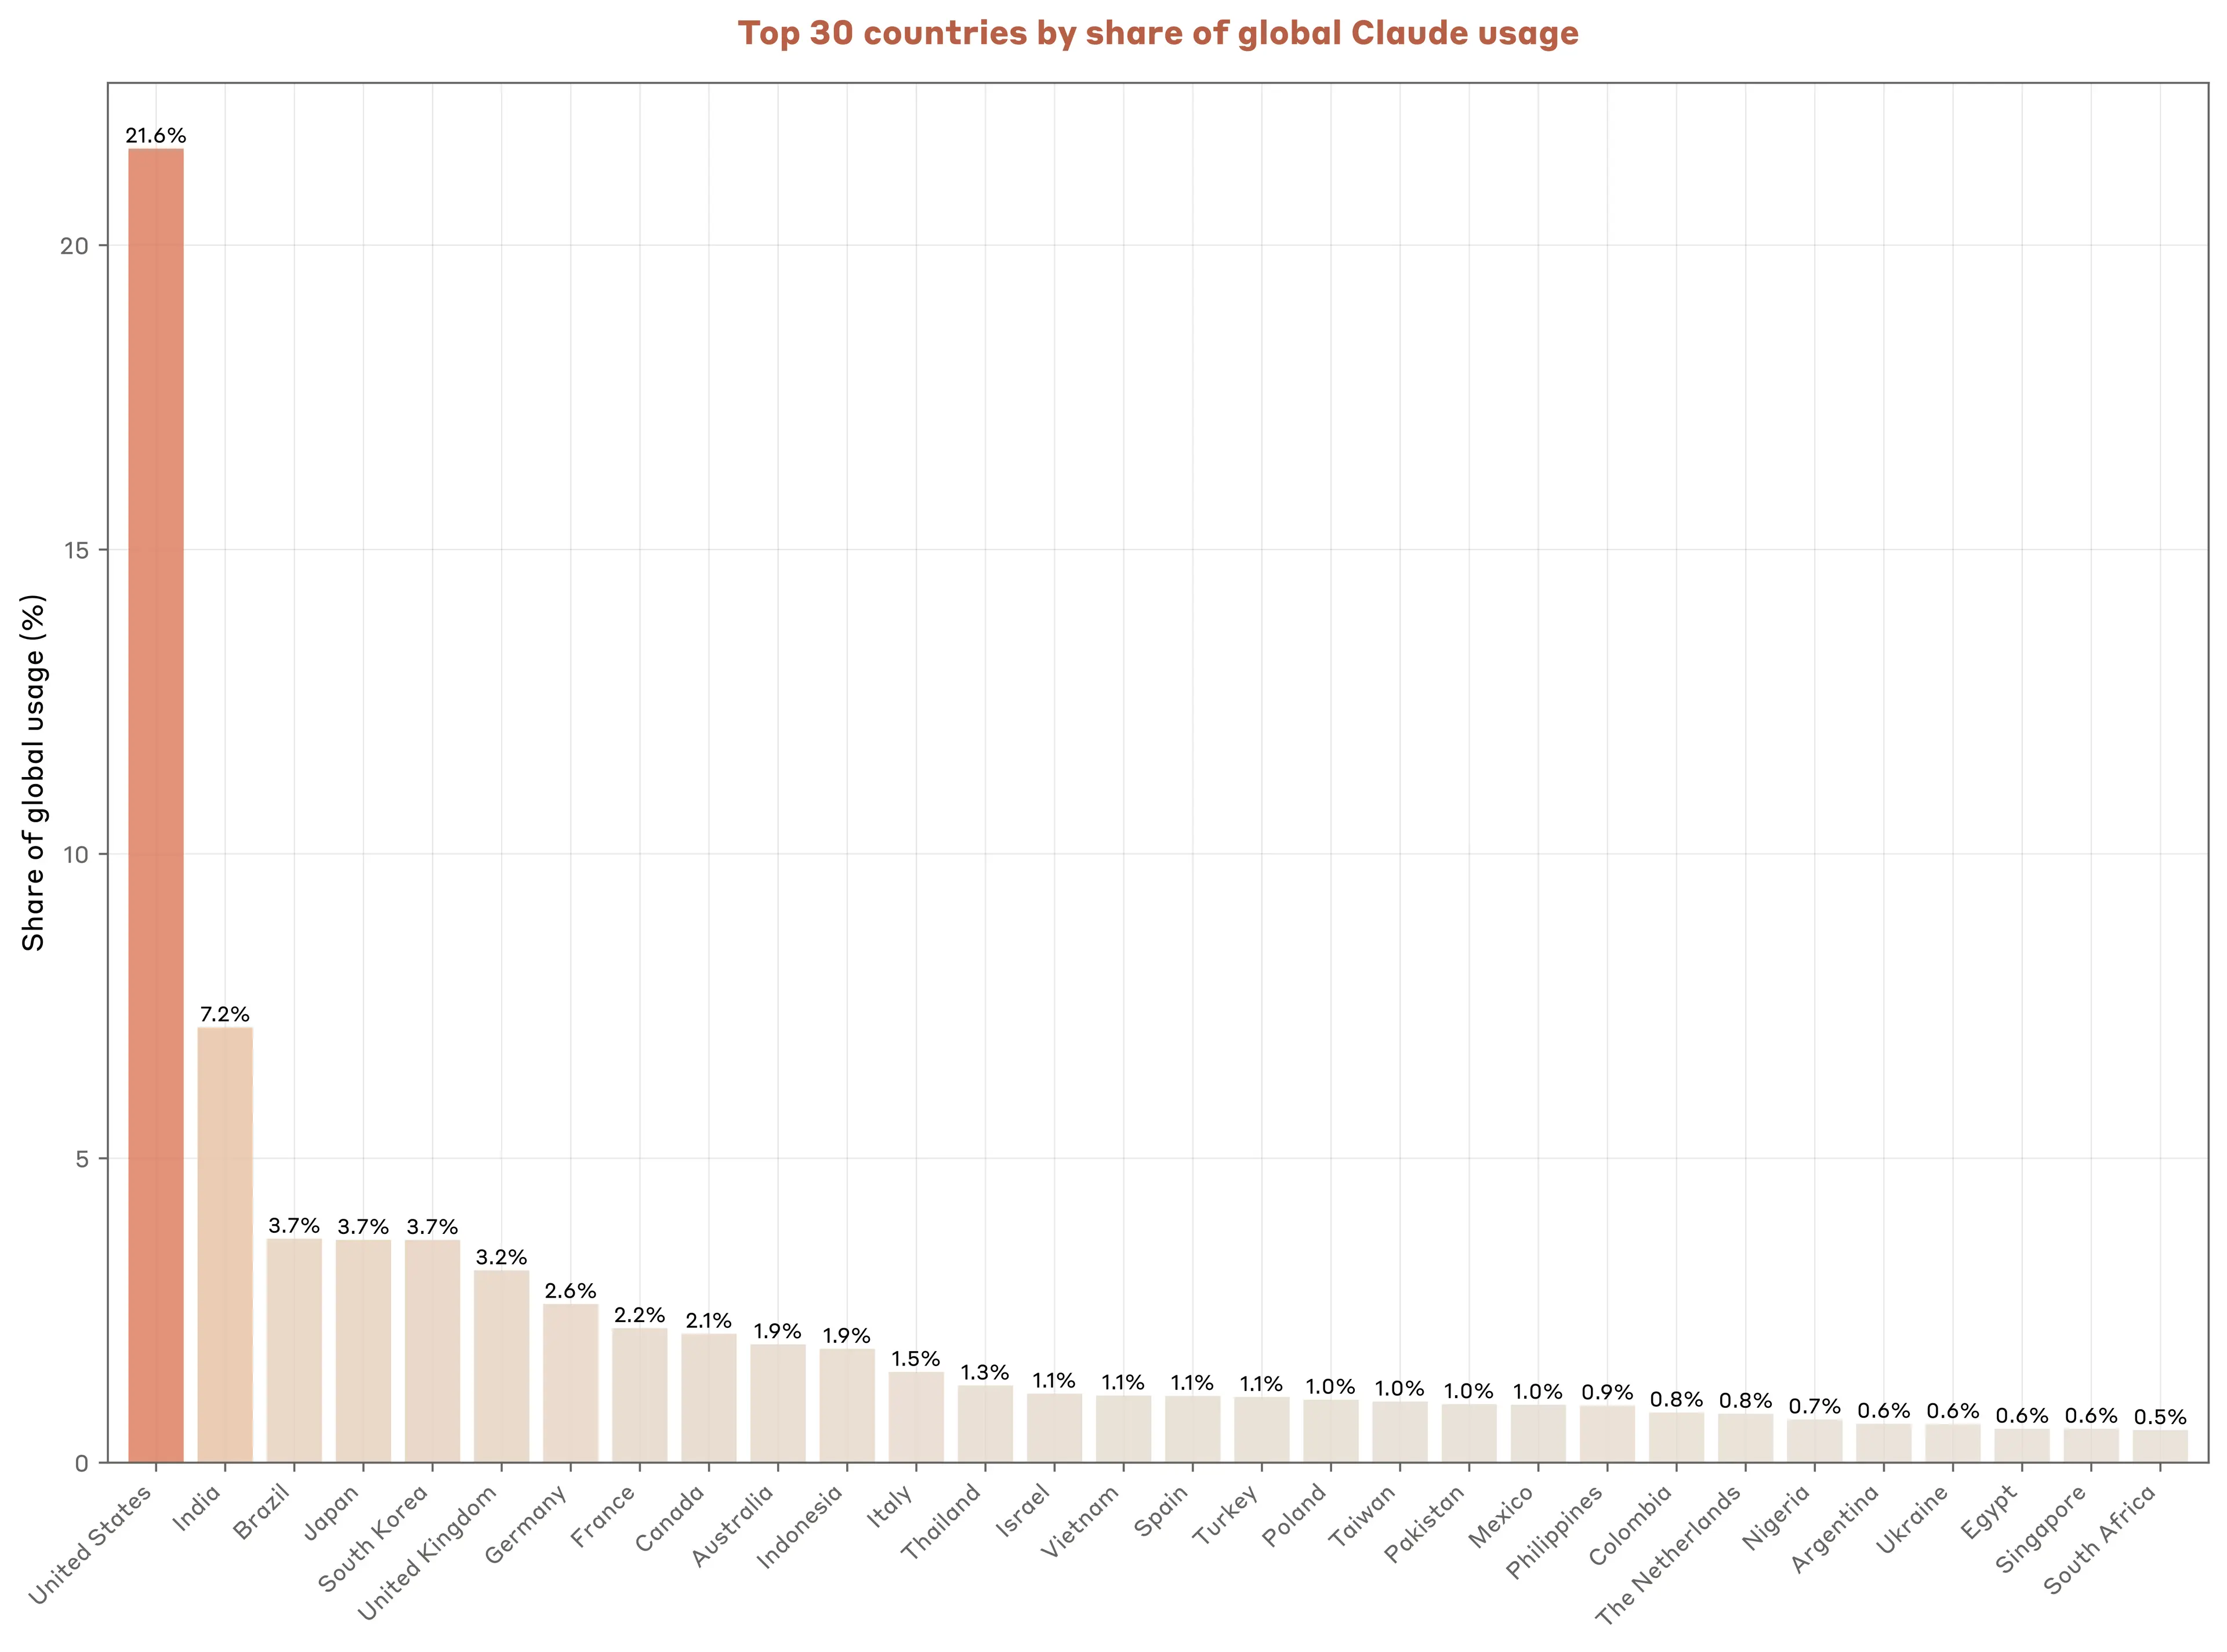
The US uses Claude far more than any other nation. India is in second place, followed by Brazil, Japan, and South Korea, each with similar shares.
However, there is huge variation in population size across these countries. To account for this, we adjust each country’s share of Claude.ai use by its share of the world’s working population. This gives us our Anthropic AI Usage Index, or AUI. Countries with an AUI greater than 1 use Claude more often than we’d expect based on their working-age population alone, and vice-versa.
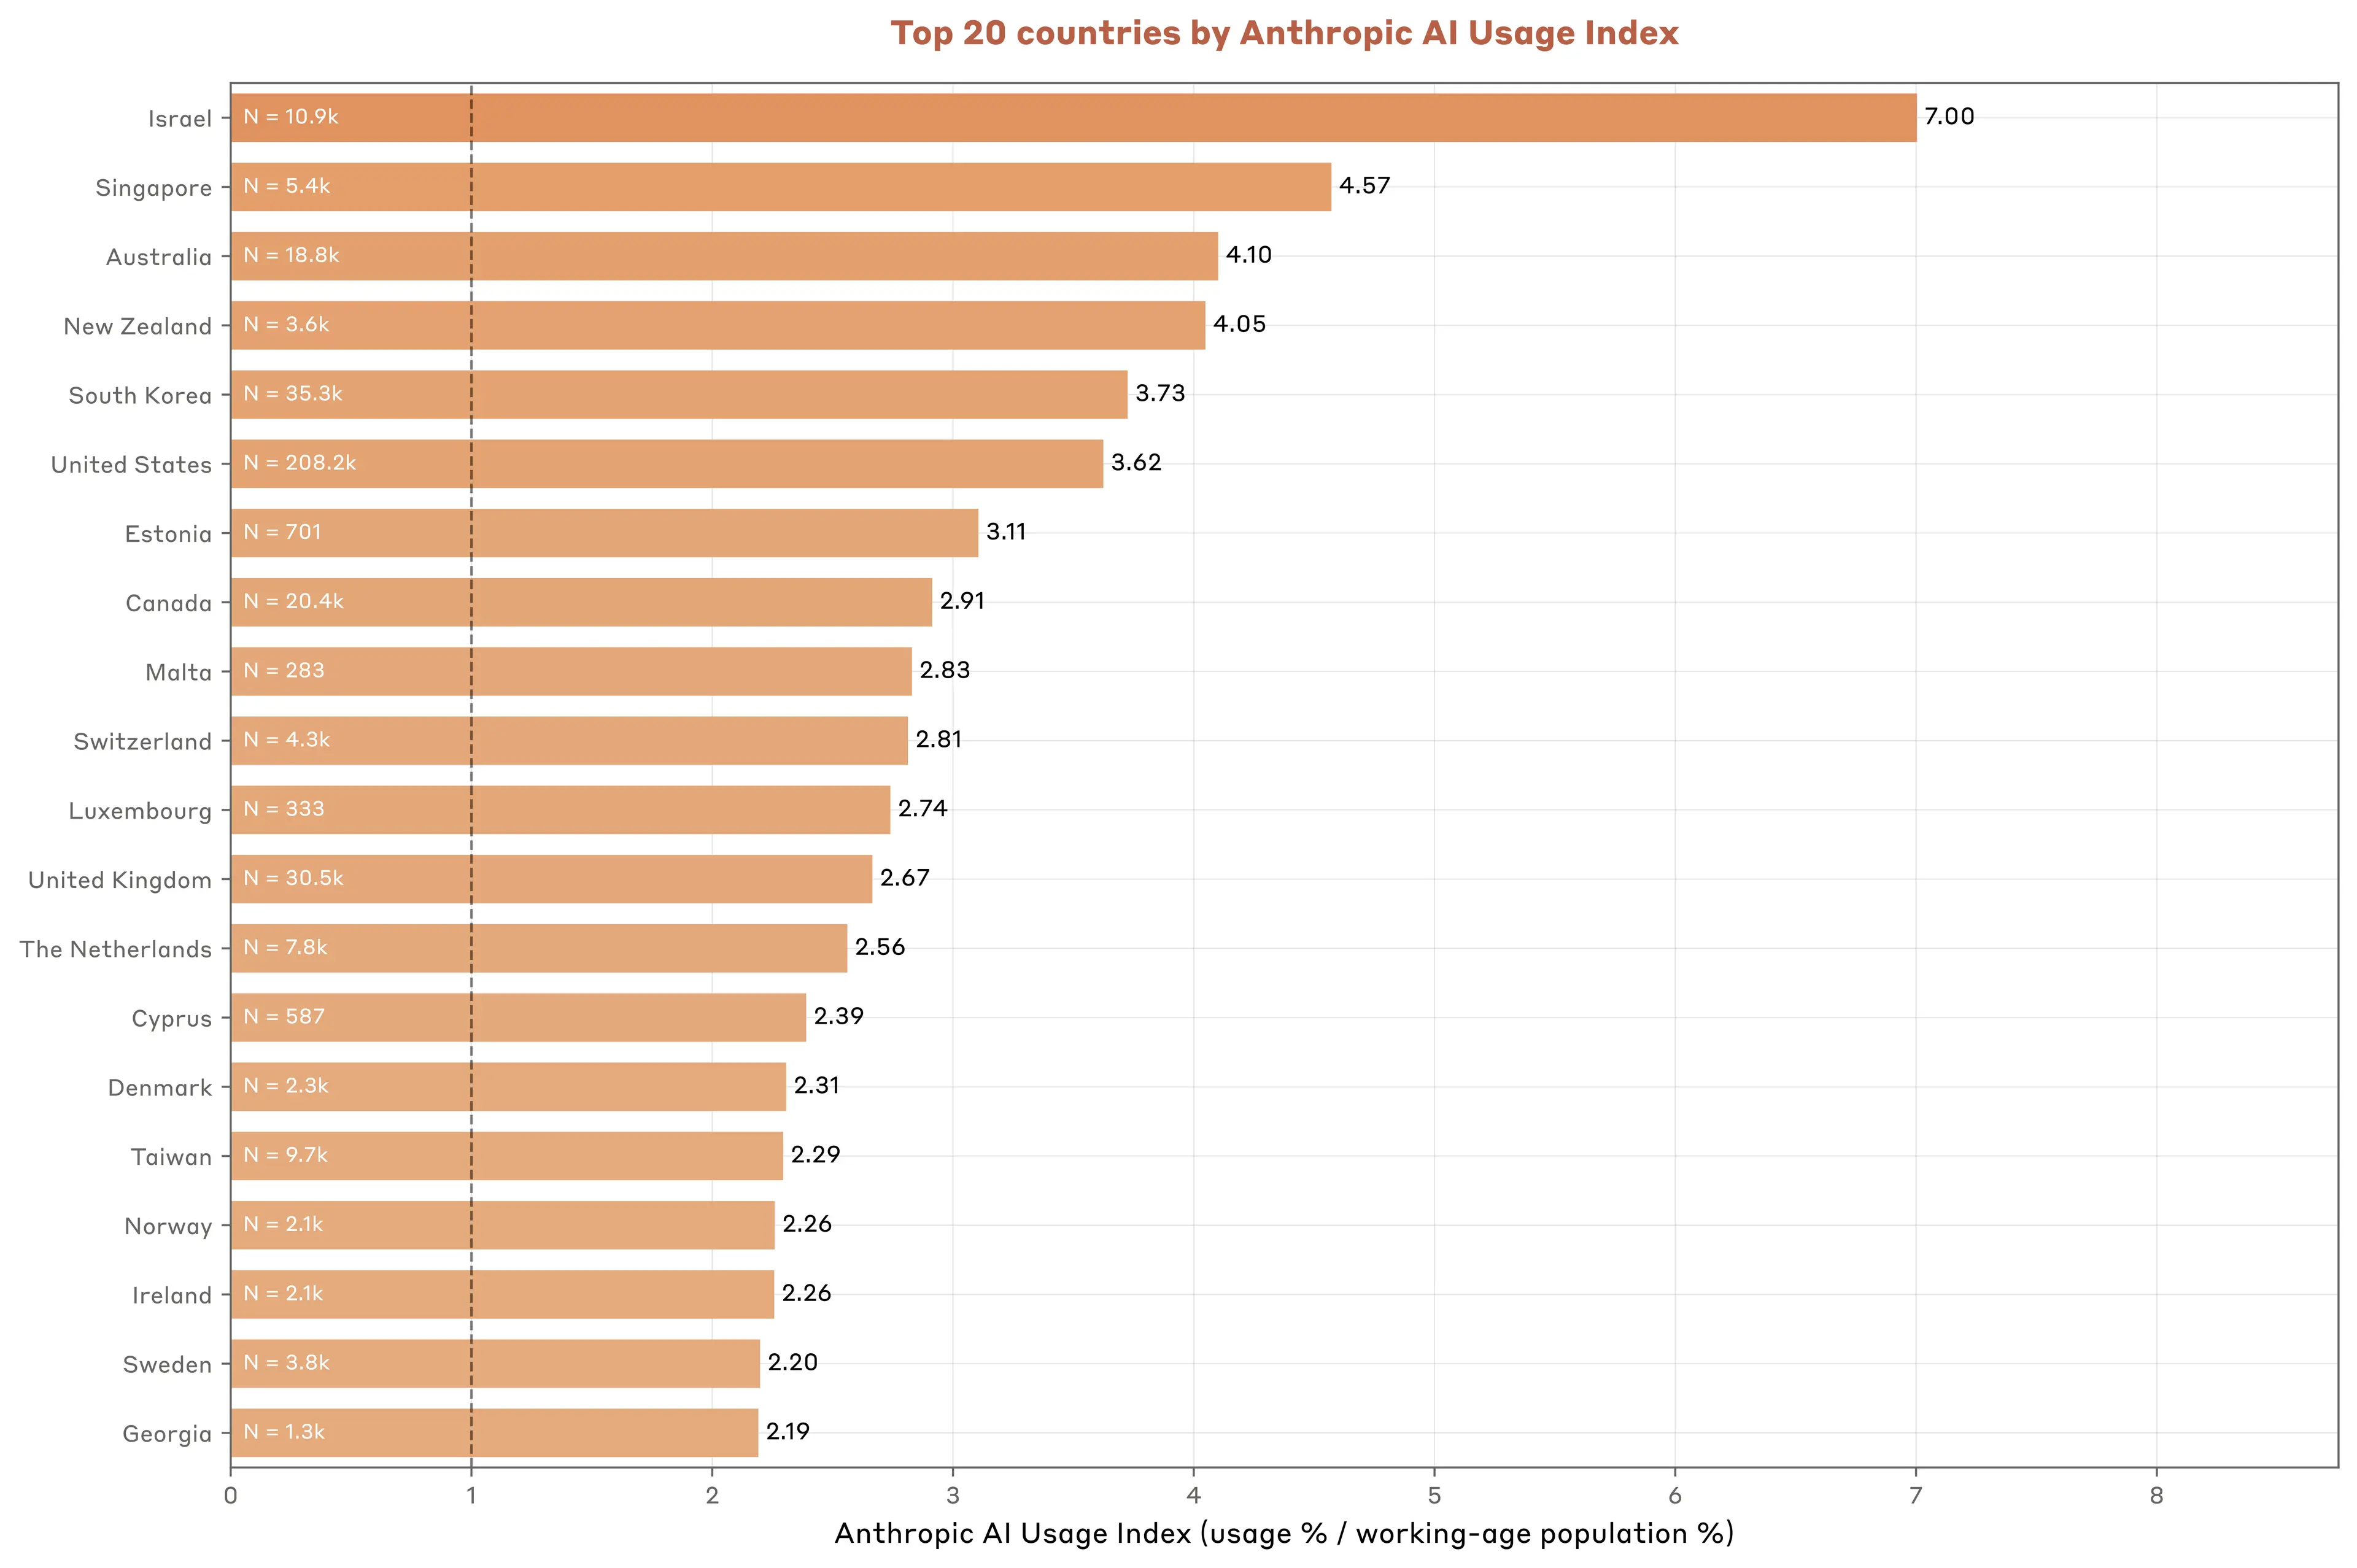
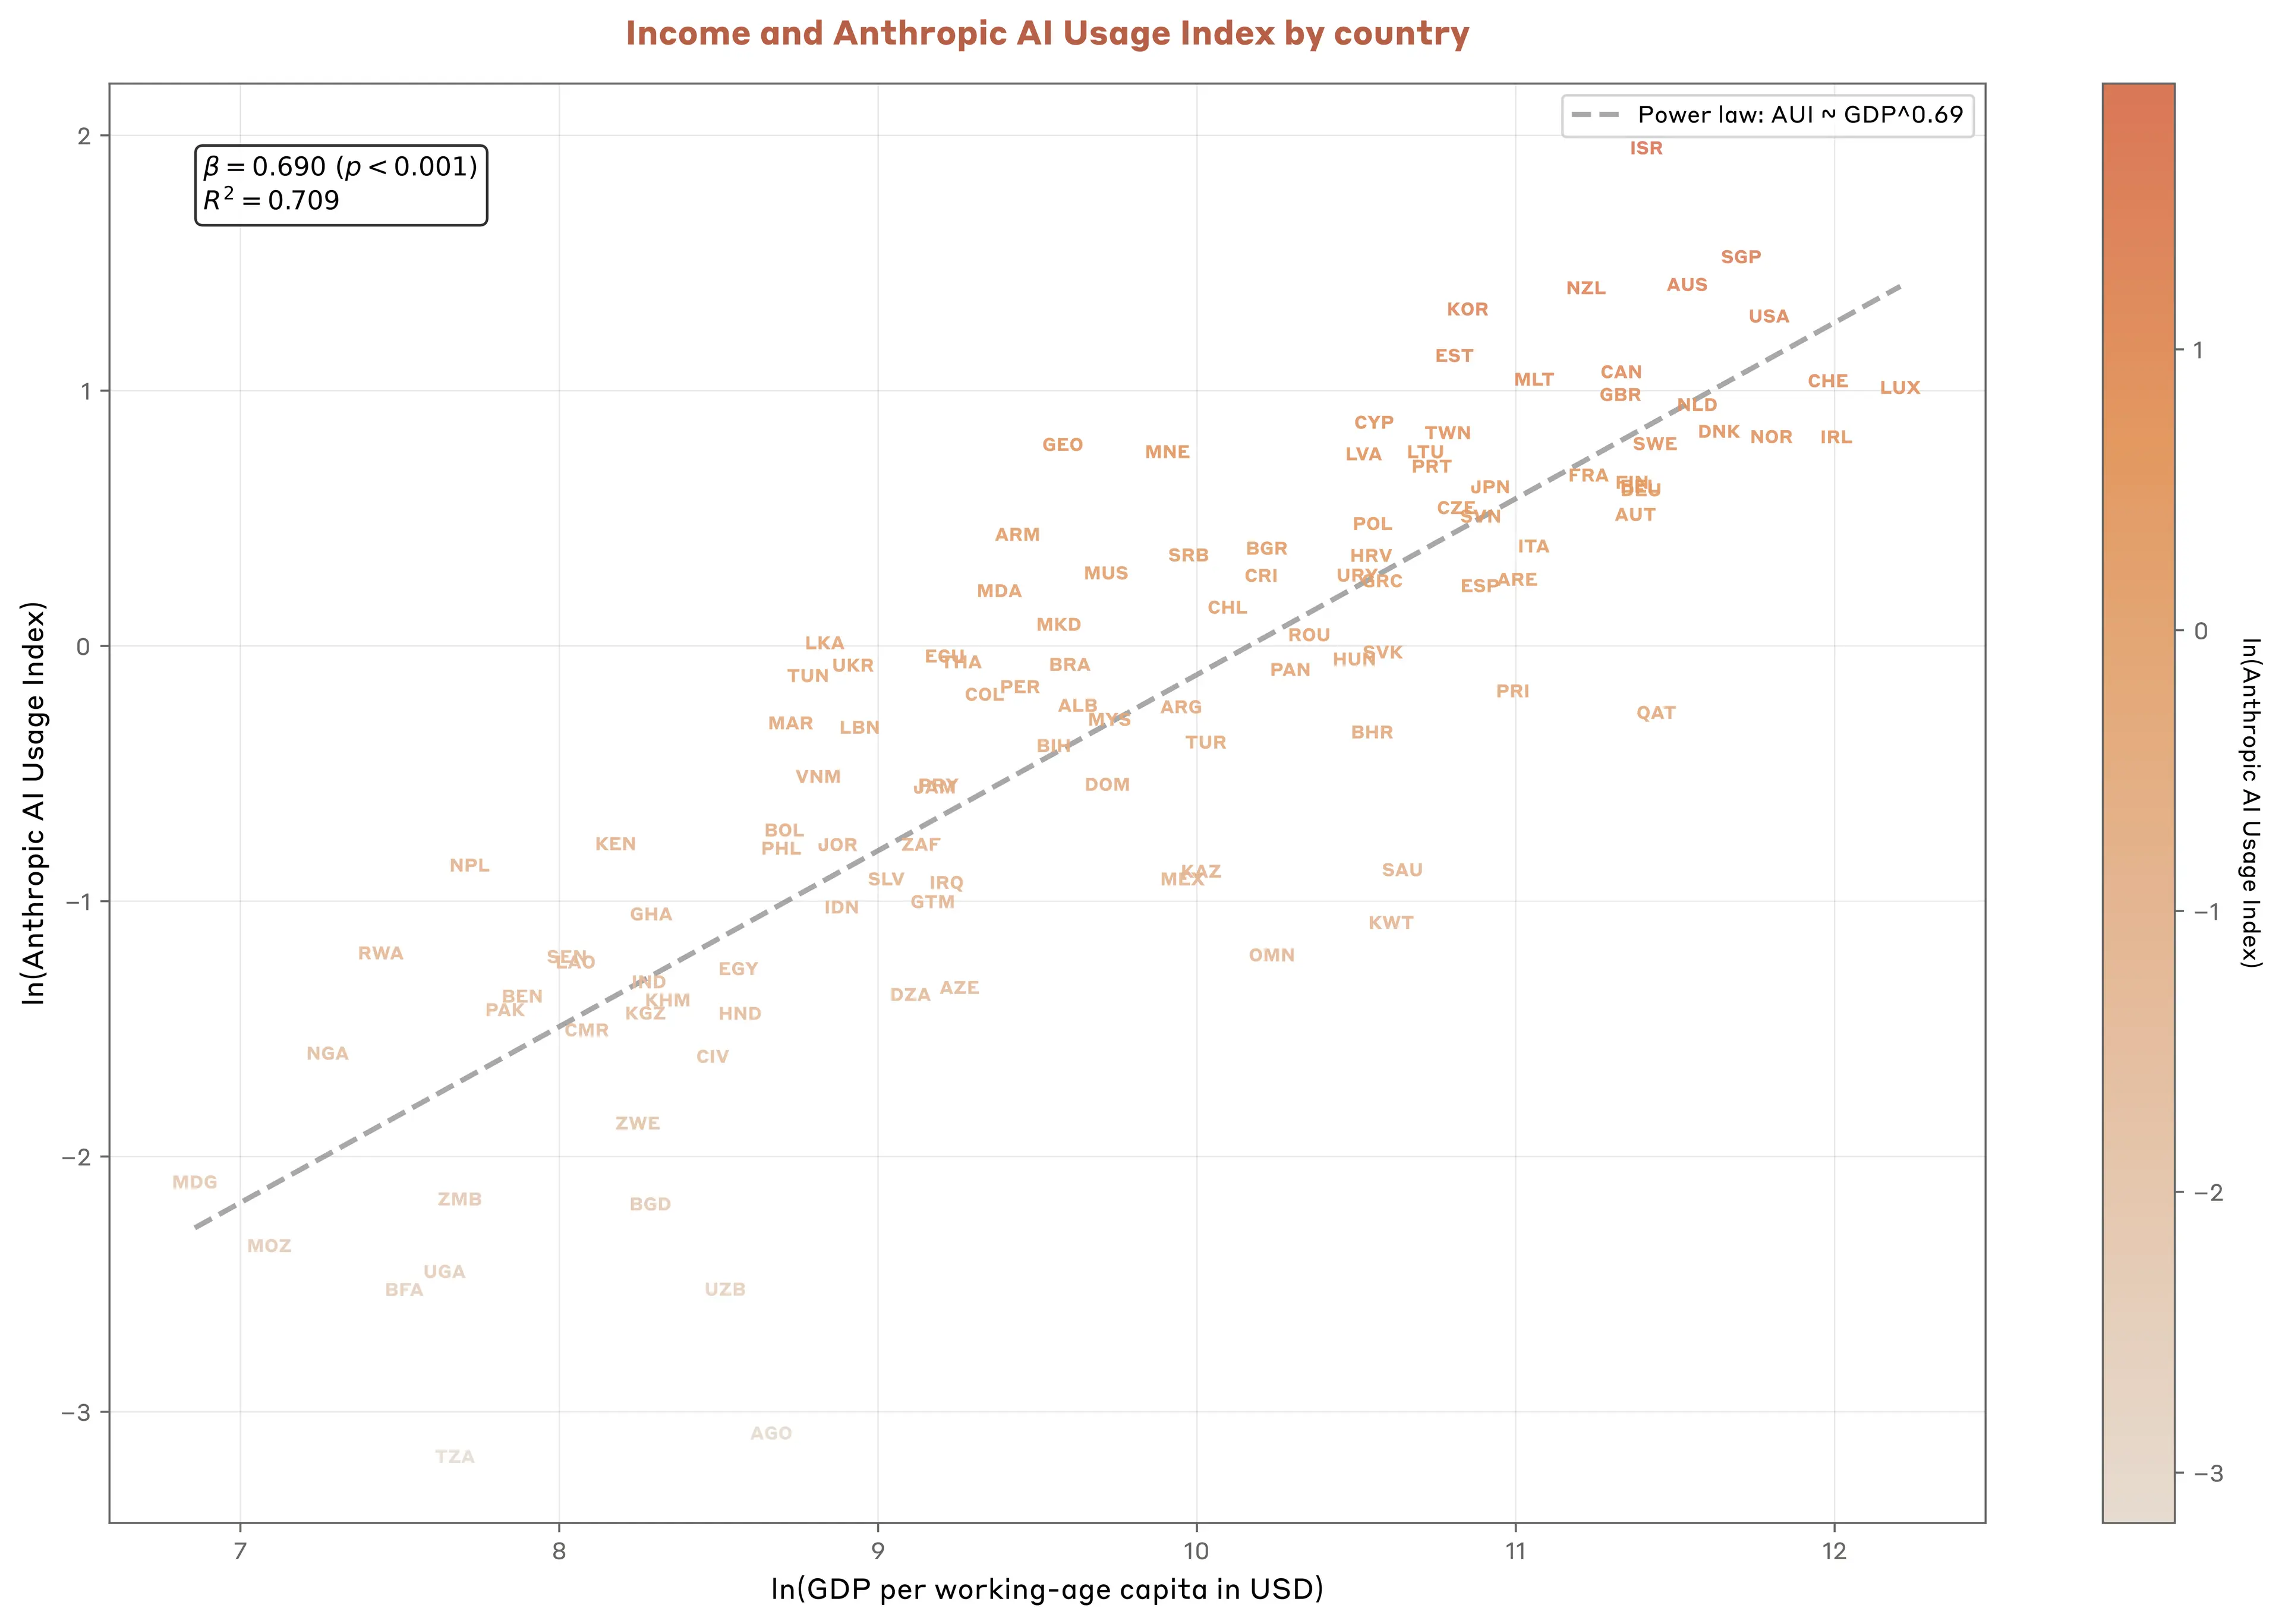
From the AUI data, we can see that some small, technologically advanced countries (like Israel and Singapore) lead in Claude adoption relative to their working-age populations. This might to a large degree be explained by income: we found a strong correlation between GDP per capita and the Anthropic AI Usage Index (a 1% higher GDP per capita was associated with a 0.7% higher AUI). This makes sense: the countries that use Claude most often generally also have robust internet connectivity, as well as economies oriented around knowledge work rather than manufacturing. But it does raise a question of economic divergence: previous general-purpose technologies, like electrification or the combustion engine, led to both vast economic growth and a great divergence in living standards around the world. If the effects of AI prove to be largest in richer countries, this general-purpose technology might have similar economic implications.
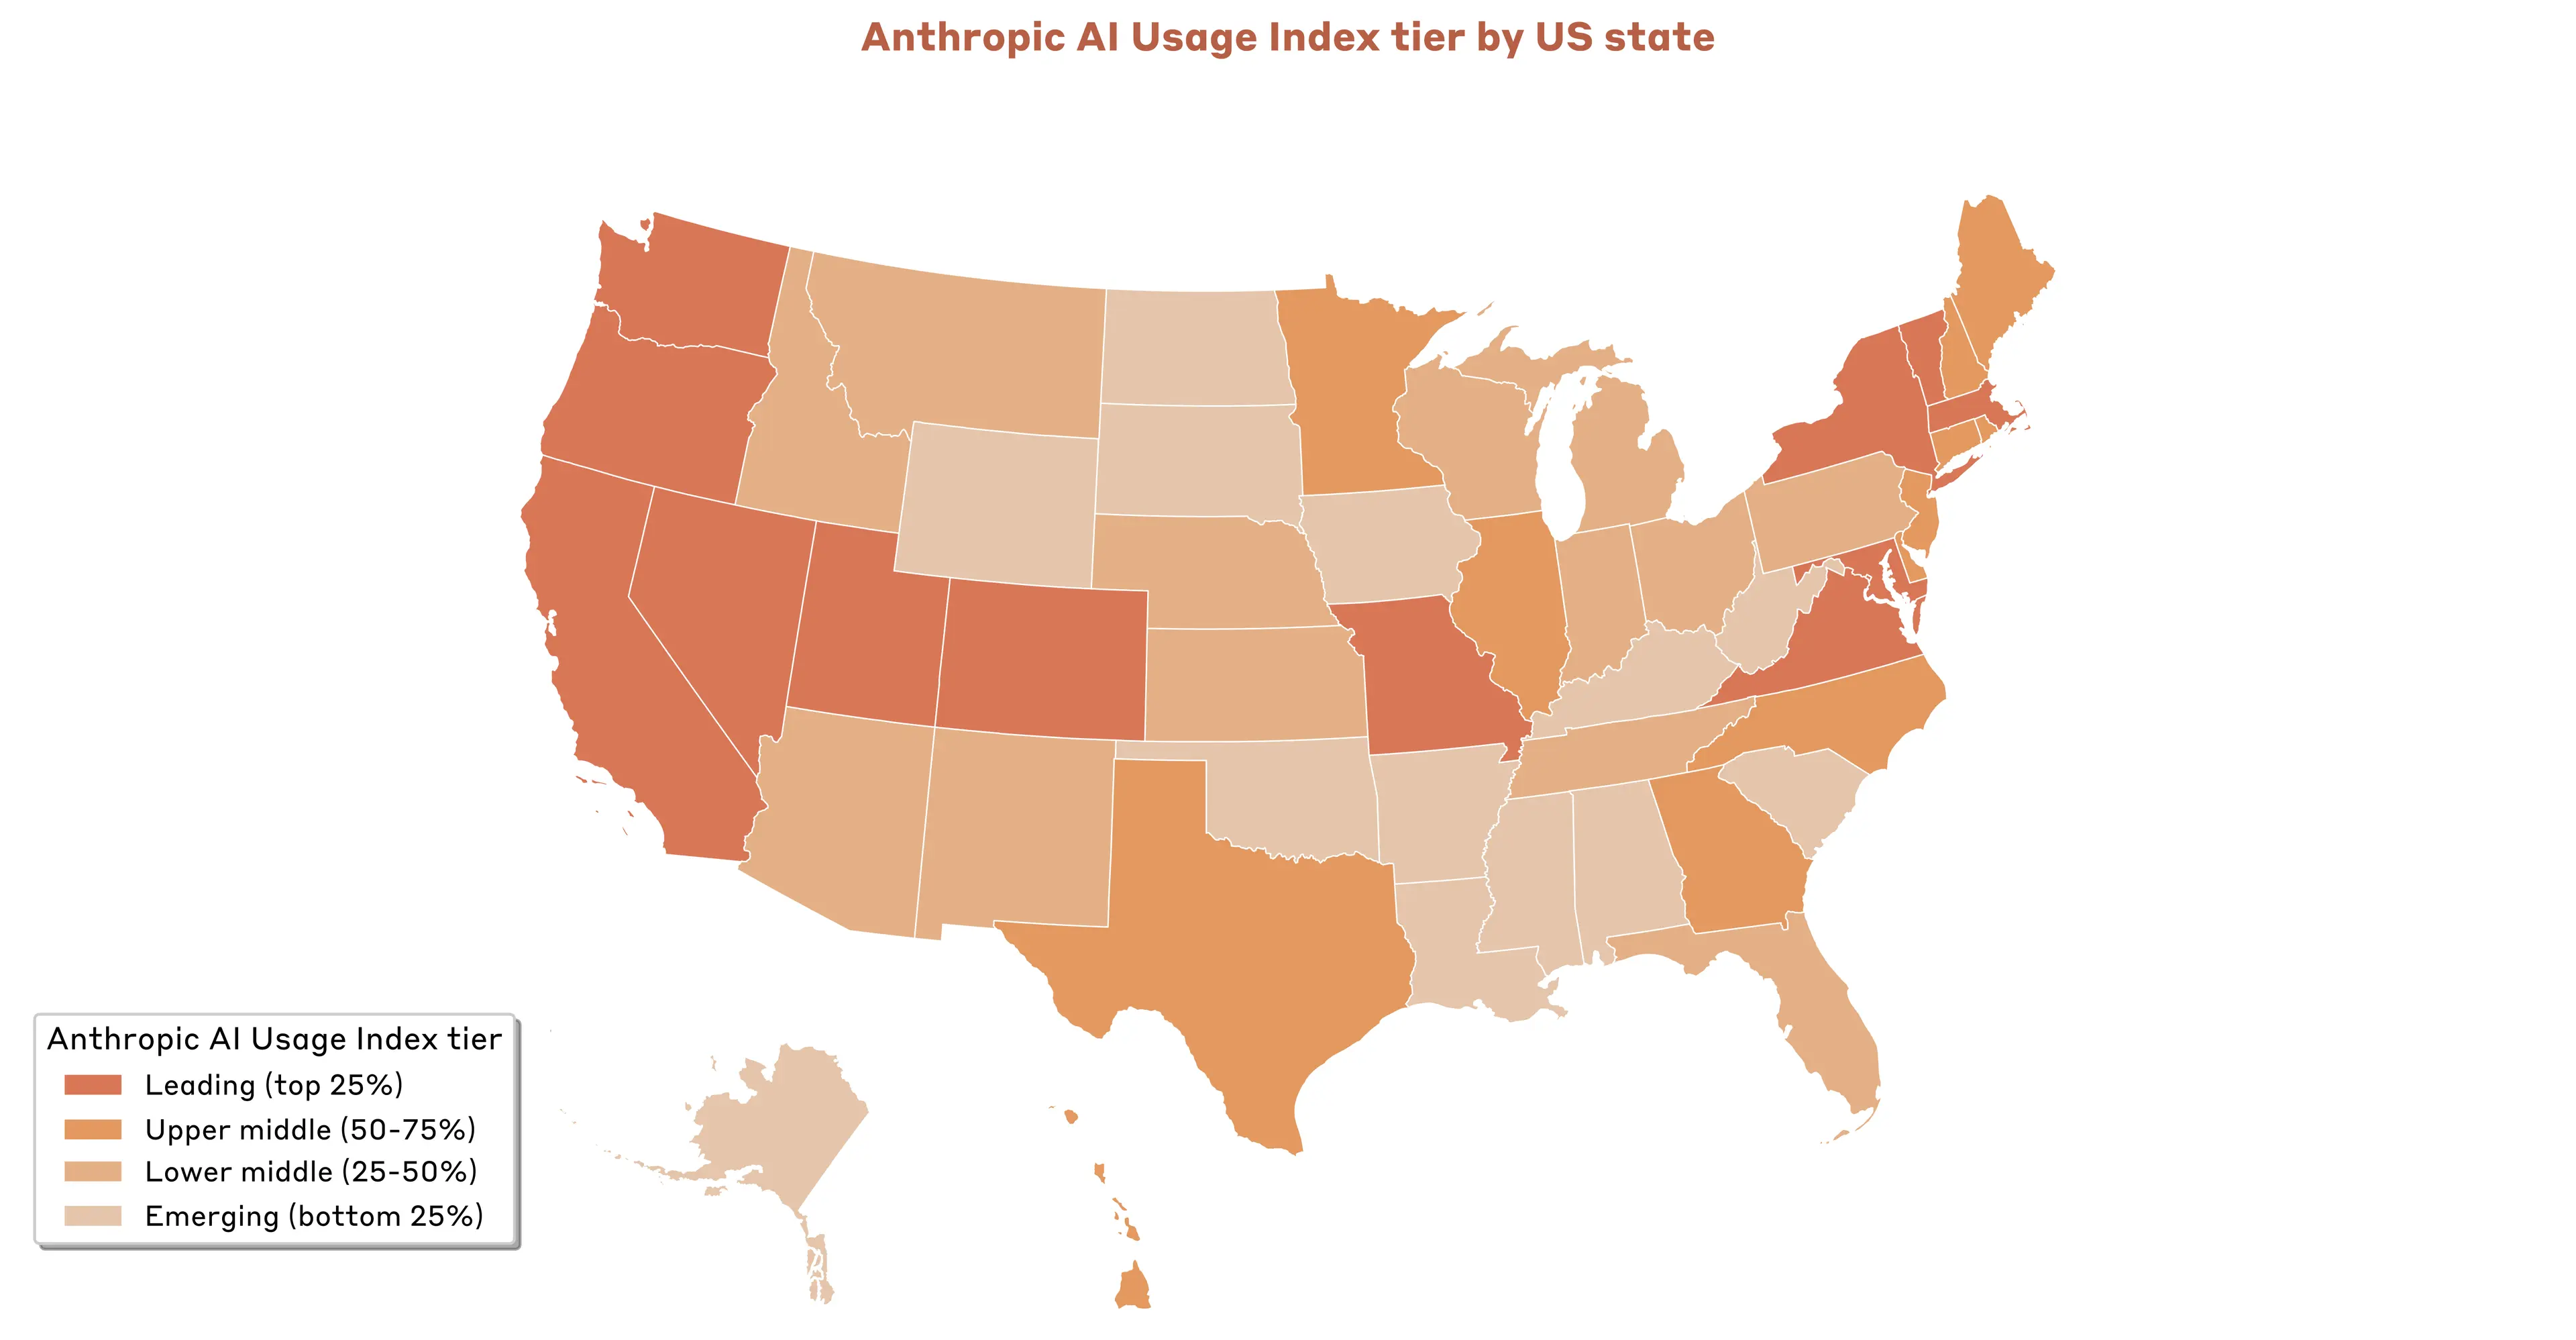
Patterns within the United States
The link between per capita GDP and per capita use of Claude also holds when comparing between US states. In fact, use rises more quickly within income here than across countries: a 1% higher per capita GDP inside the US is associated with a 1.8% higher population-adjusted use of Claude. That said, income actually has less explanatory power within the US than across countries, as there’s much higher variance within the overall trend. That is: other factors, beyond income, must explain more of the variation in population-adjusted use.
What else could explain this adoption gap? Our best guess is that it’s differences in the composition of states’ economies. The highest AUI in the US is the District of Columbia (3.82), where the most disproportionately frequent uses of Claude are editing documents and searching for information, among other tasks associated with knowledge work in DC. Similarly, coding-related tasks are especially common in California (the state with the third-highest AUI overall), and finance-related tasks are especially common in New York (which comes in fourth).1 Even among states with lower population-adjusted use of Claude, like Hawaii, use is closely correlated to the structure of the economy: people in Hawaii request Claude’s assistance for tourism-related tasks at twice the rate of the rest of America. Our interactive website contains plenty of other statistics like these.
Trends in Claude use
We’ve been tracking how people use Claude since December 2024. We use a privacy-preserving classification method that categorizes anonymized conversation transcripts into task groups defined by O*NET, a US government database that classifies jobs and the tasks associated with them.2 By doing this, we can analyze both how the tasks that people give Claude have changed since last year, and how the ways people choose to collaborate—how much oversight and input into Claude’s work they choose to have—have changed too.
Tasks
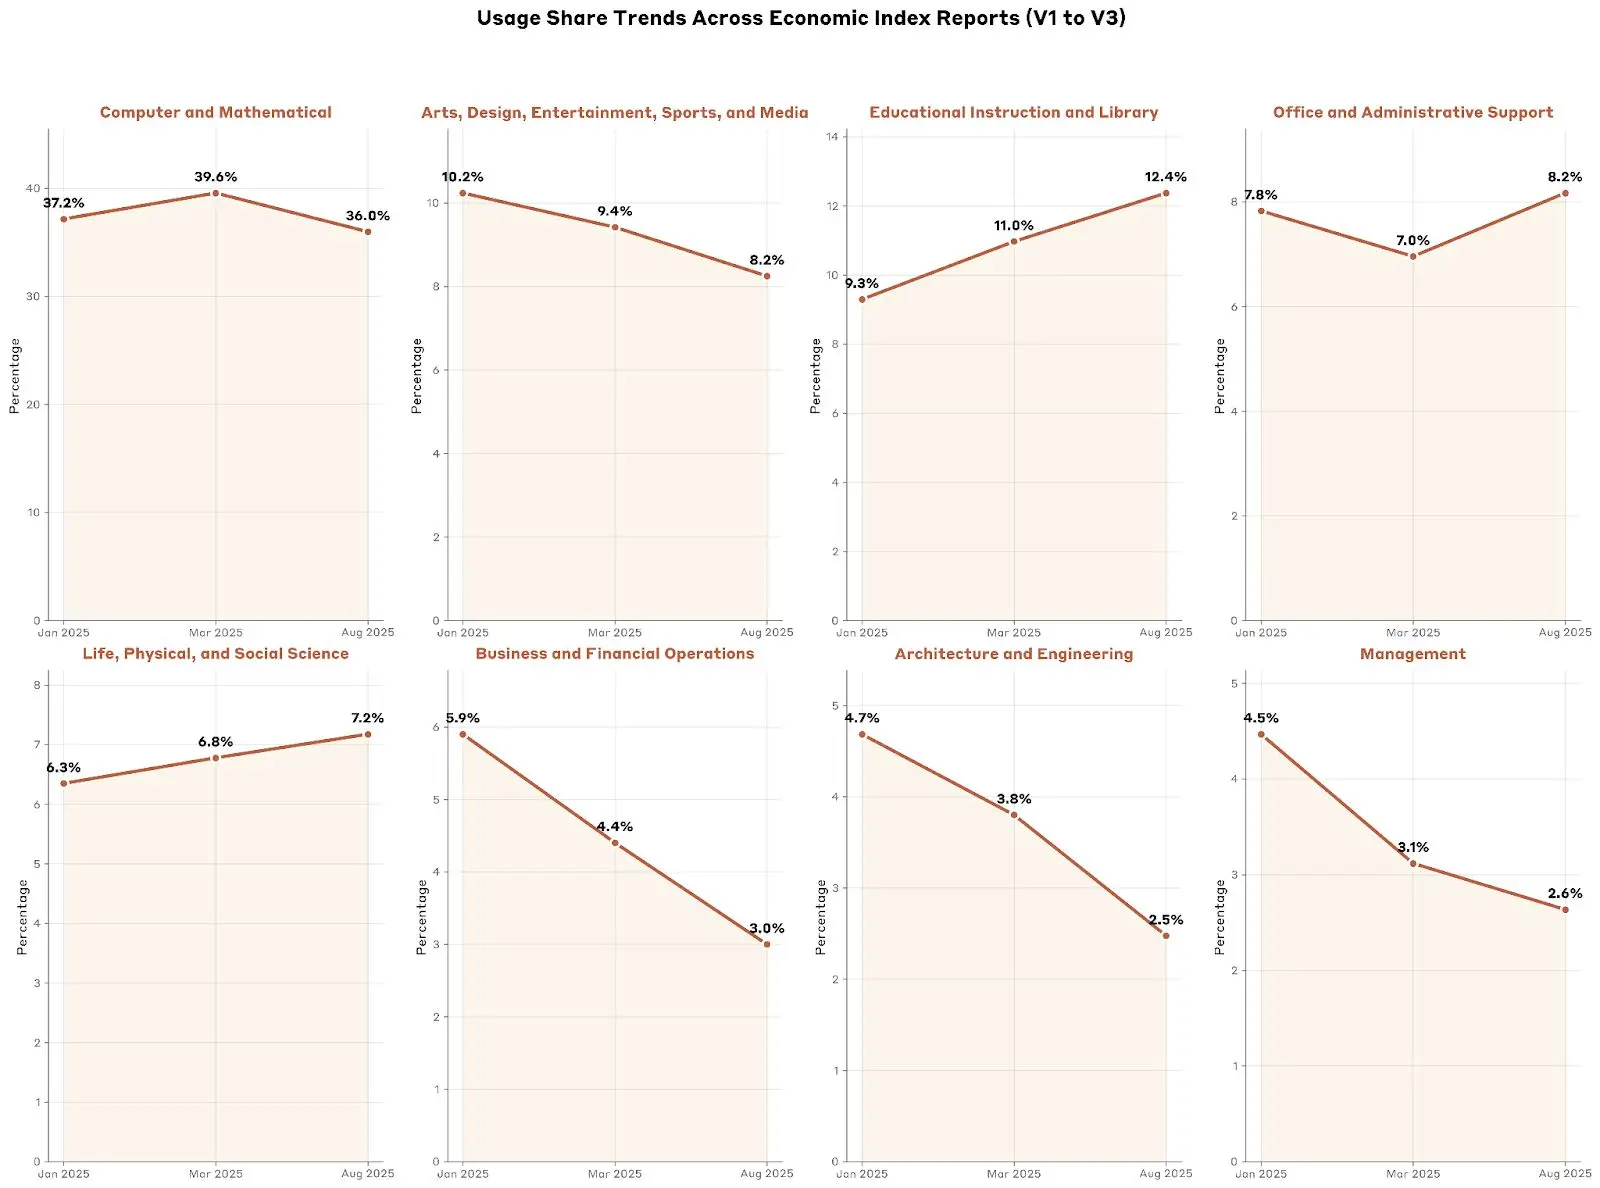
Since December 2024, computer and mathematical uses of Claude have predominated among our categories, representing around 37-40% of conversations.
But a lot has changed. Over the past nine months, we’ve seen consistent growth in “knowledge-intensive” fields. For example, educational instruction tasks have risen by more than 40 percent (from 9% to 13% of all conversations), and the share of tasks associated with the physical and social sciences has increased by a third (from 6% to 8%). In the meantime, the relative frequency of traditional business tasks has declined: management-related tasks have fallen from 5% of all conversations to 3%, and the share of tasks related to business and financial operations has halved, from 6% to 3%. (In absolute terms, of course, the number of conversations in each category has still risen significantly.)
The overall trend is noisy, but generally, as the GDP per capita of a country increases, the use of Claude shifts away from tasks in the Computer and Mathematical occupation group, and towards a diverse range of other activities, like education, art and design; office and administrative support; and the physical and social sciences. Compare the trend line in the first graph below to the remaining three:
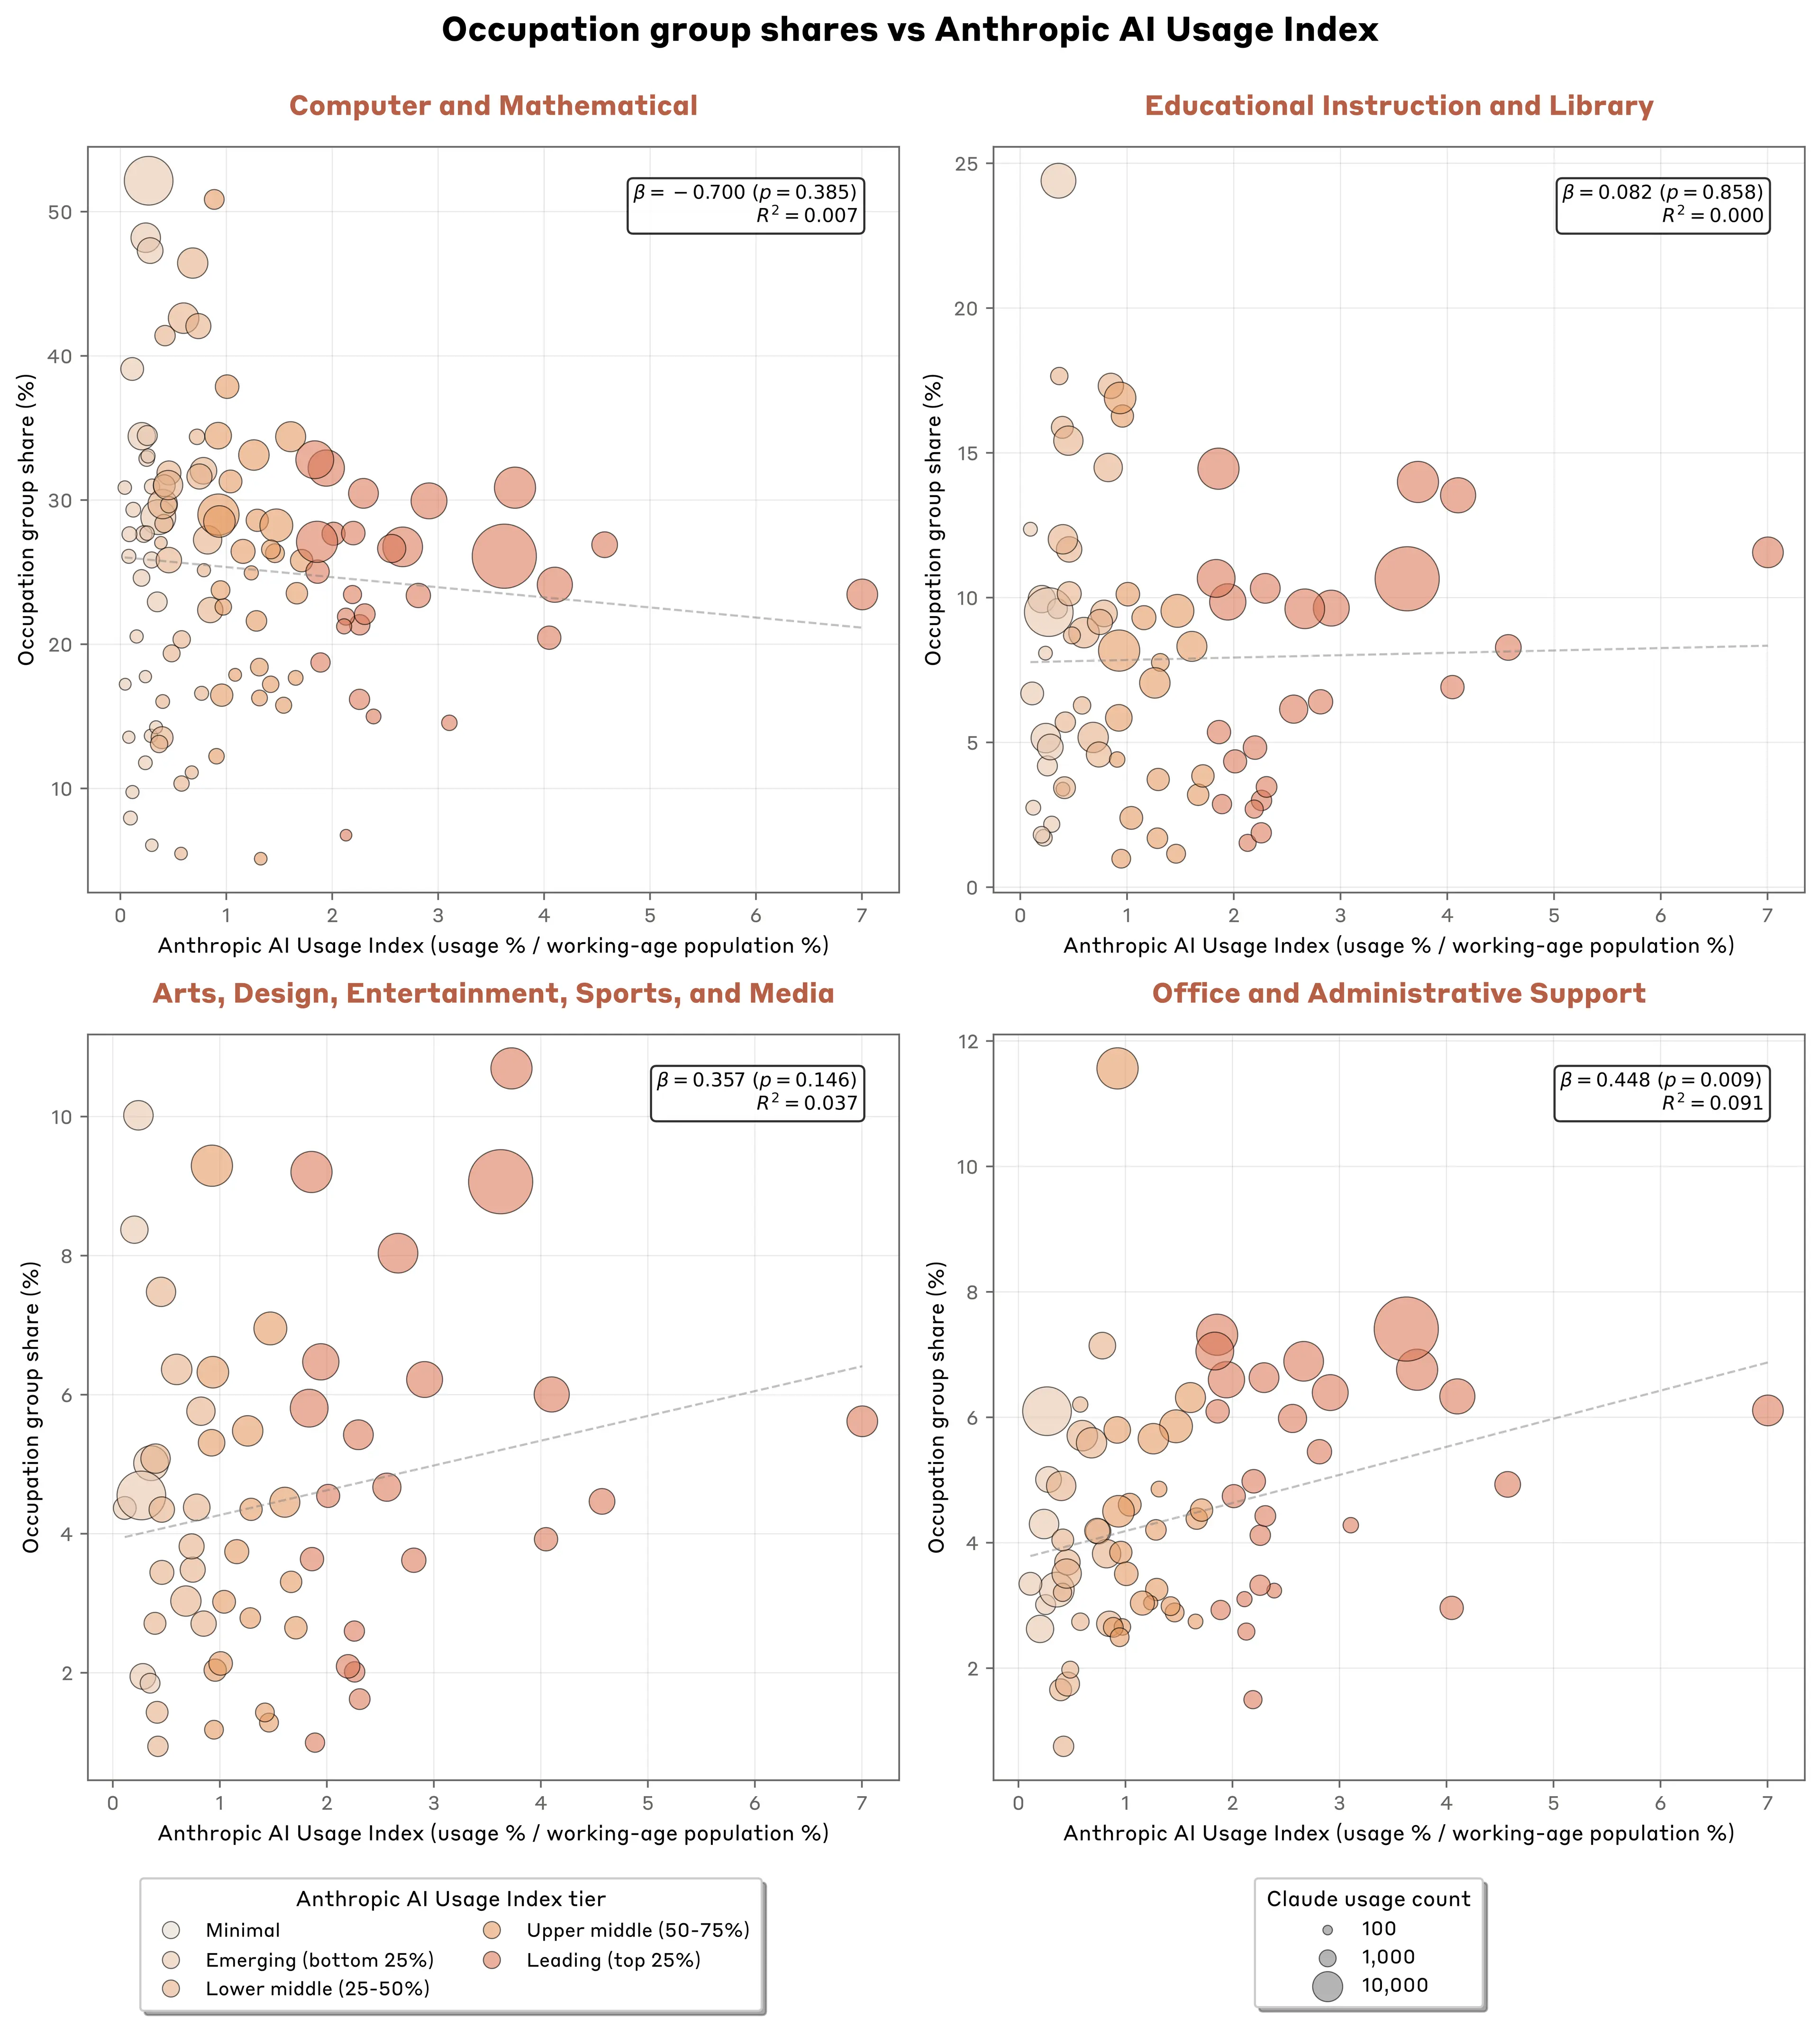
All that said, software development remains the most common use in every single country we track. The picture looks similar in the US, although our sample size limits our ability to explore in more detail how the task mix varies with adoption rates.
Patterns of interaction
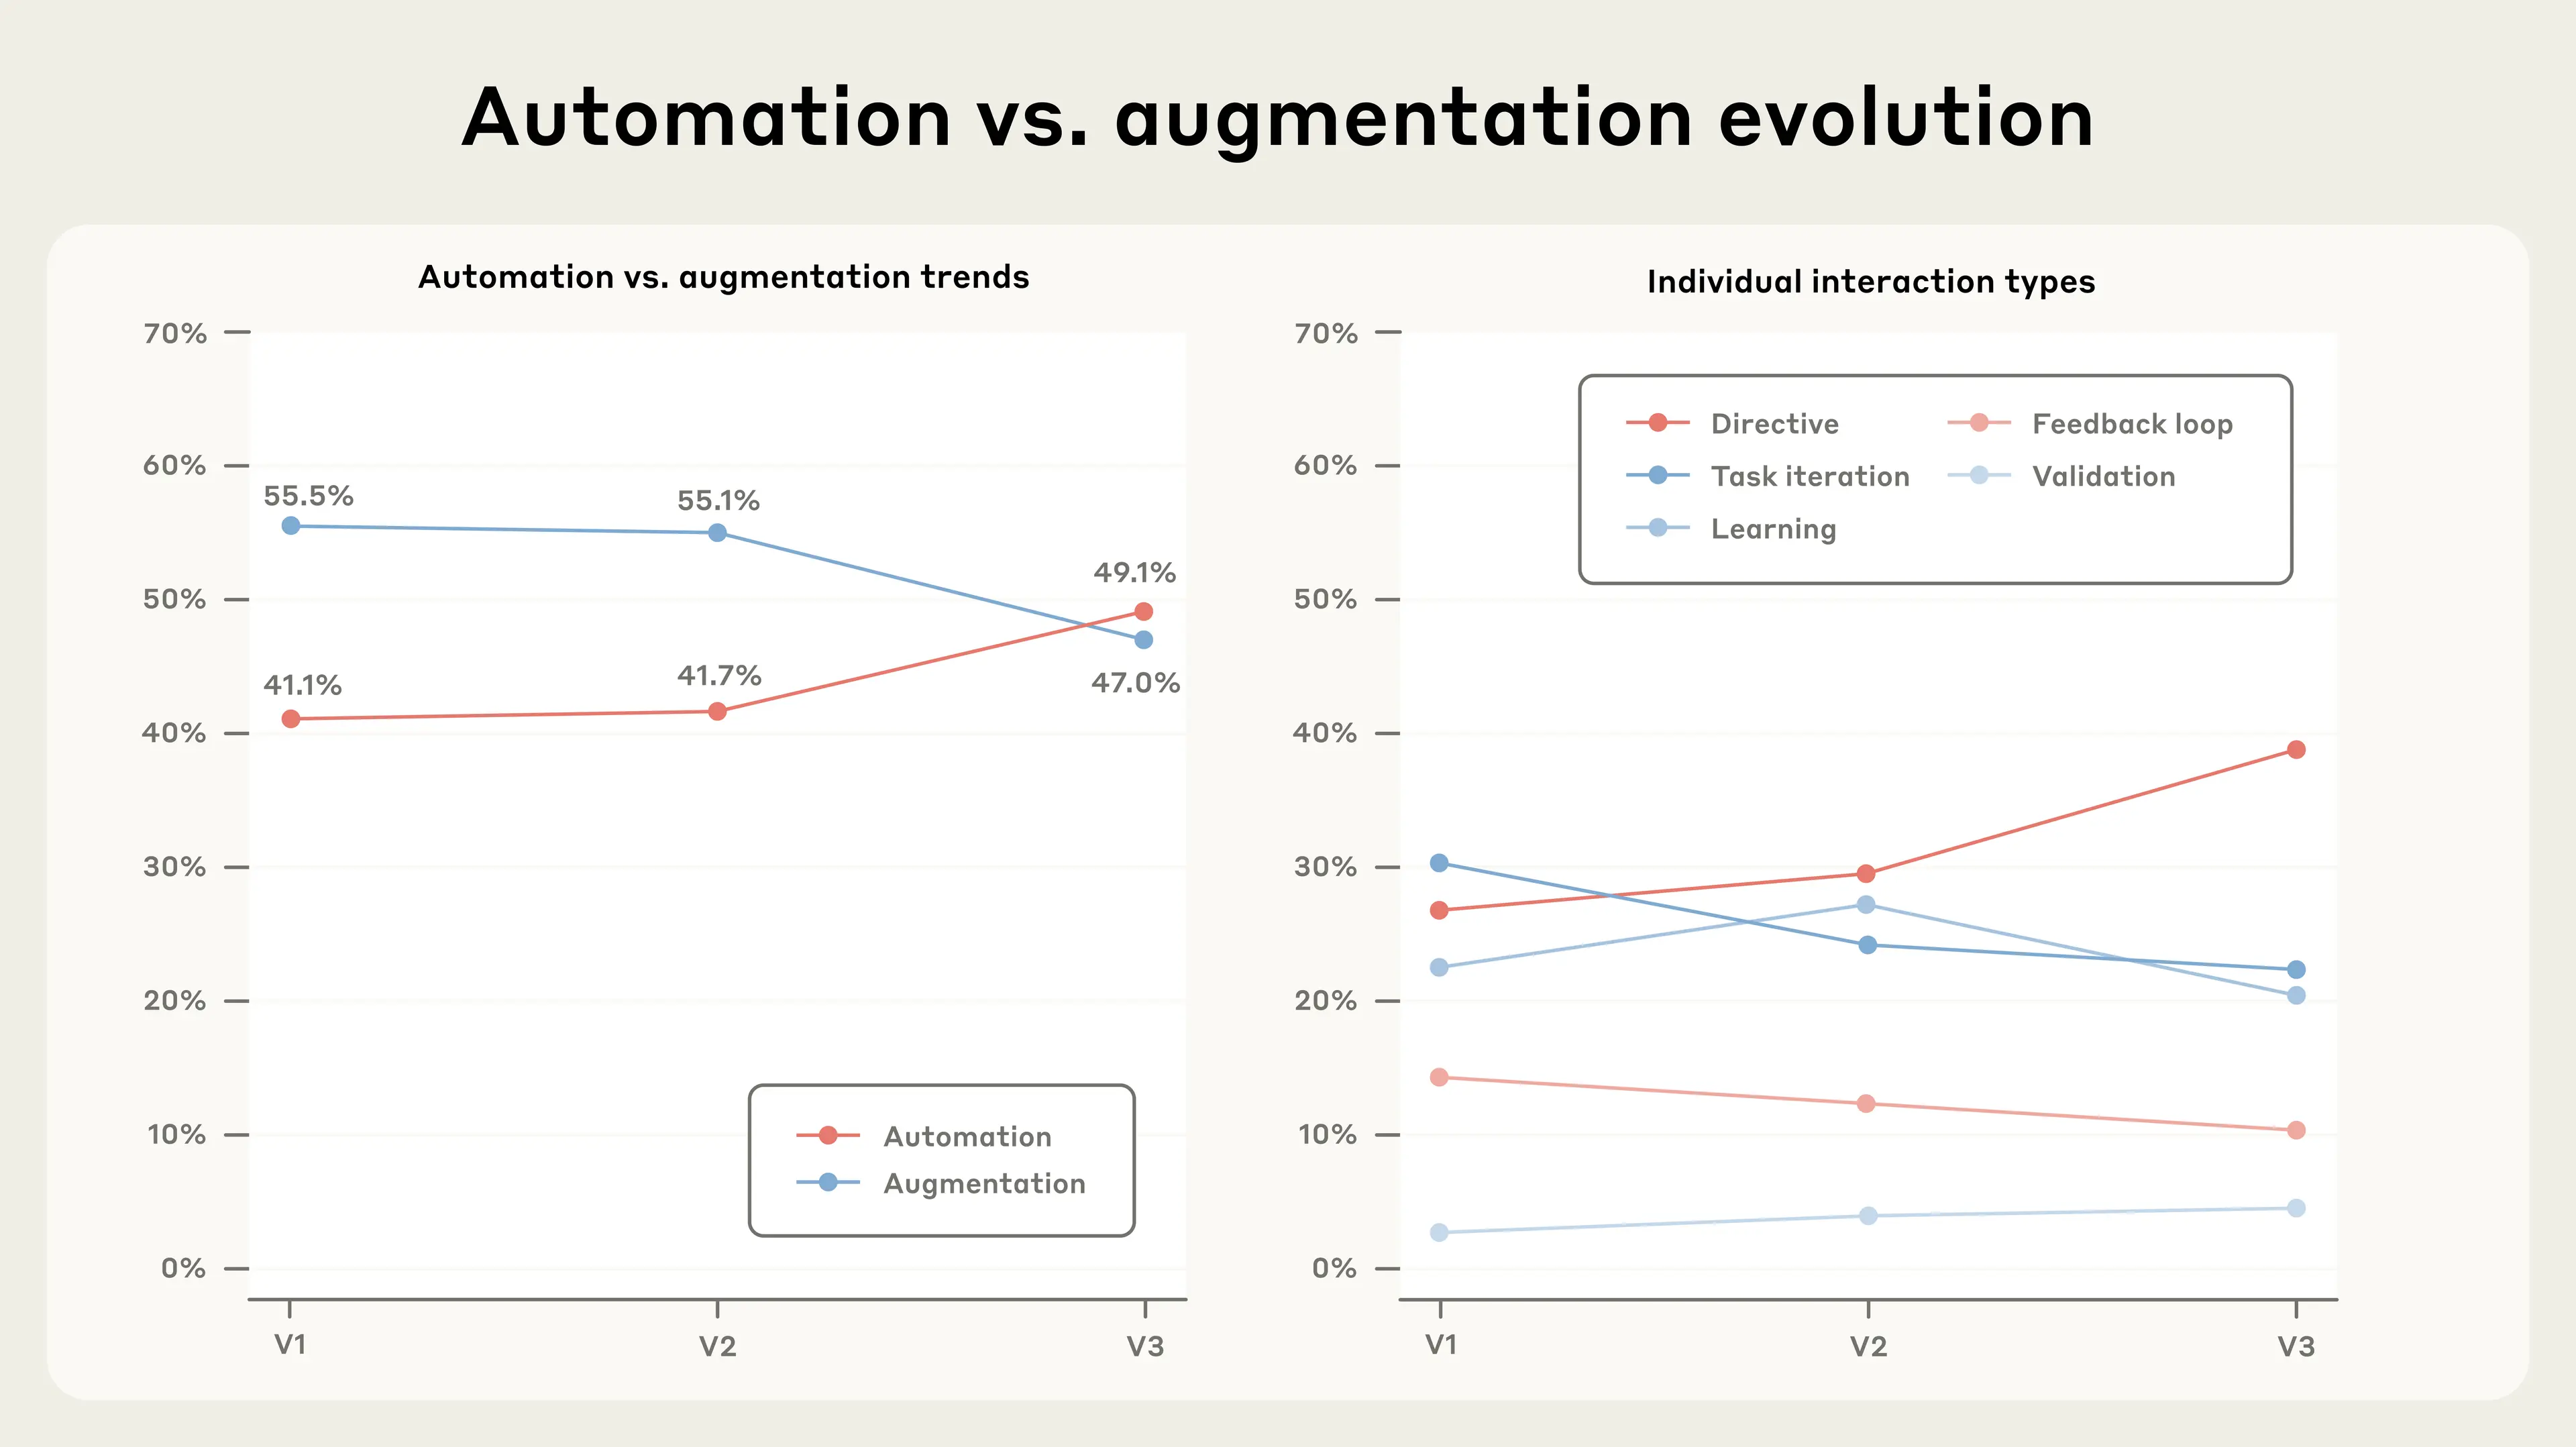
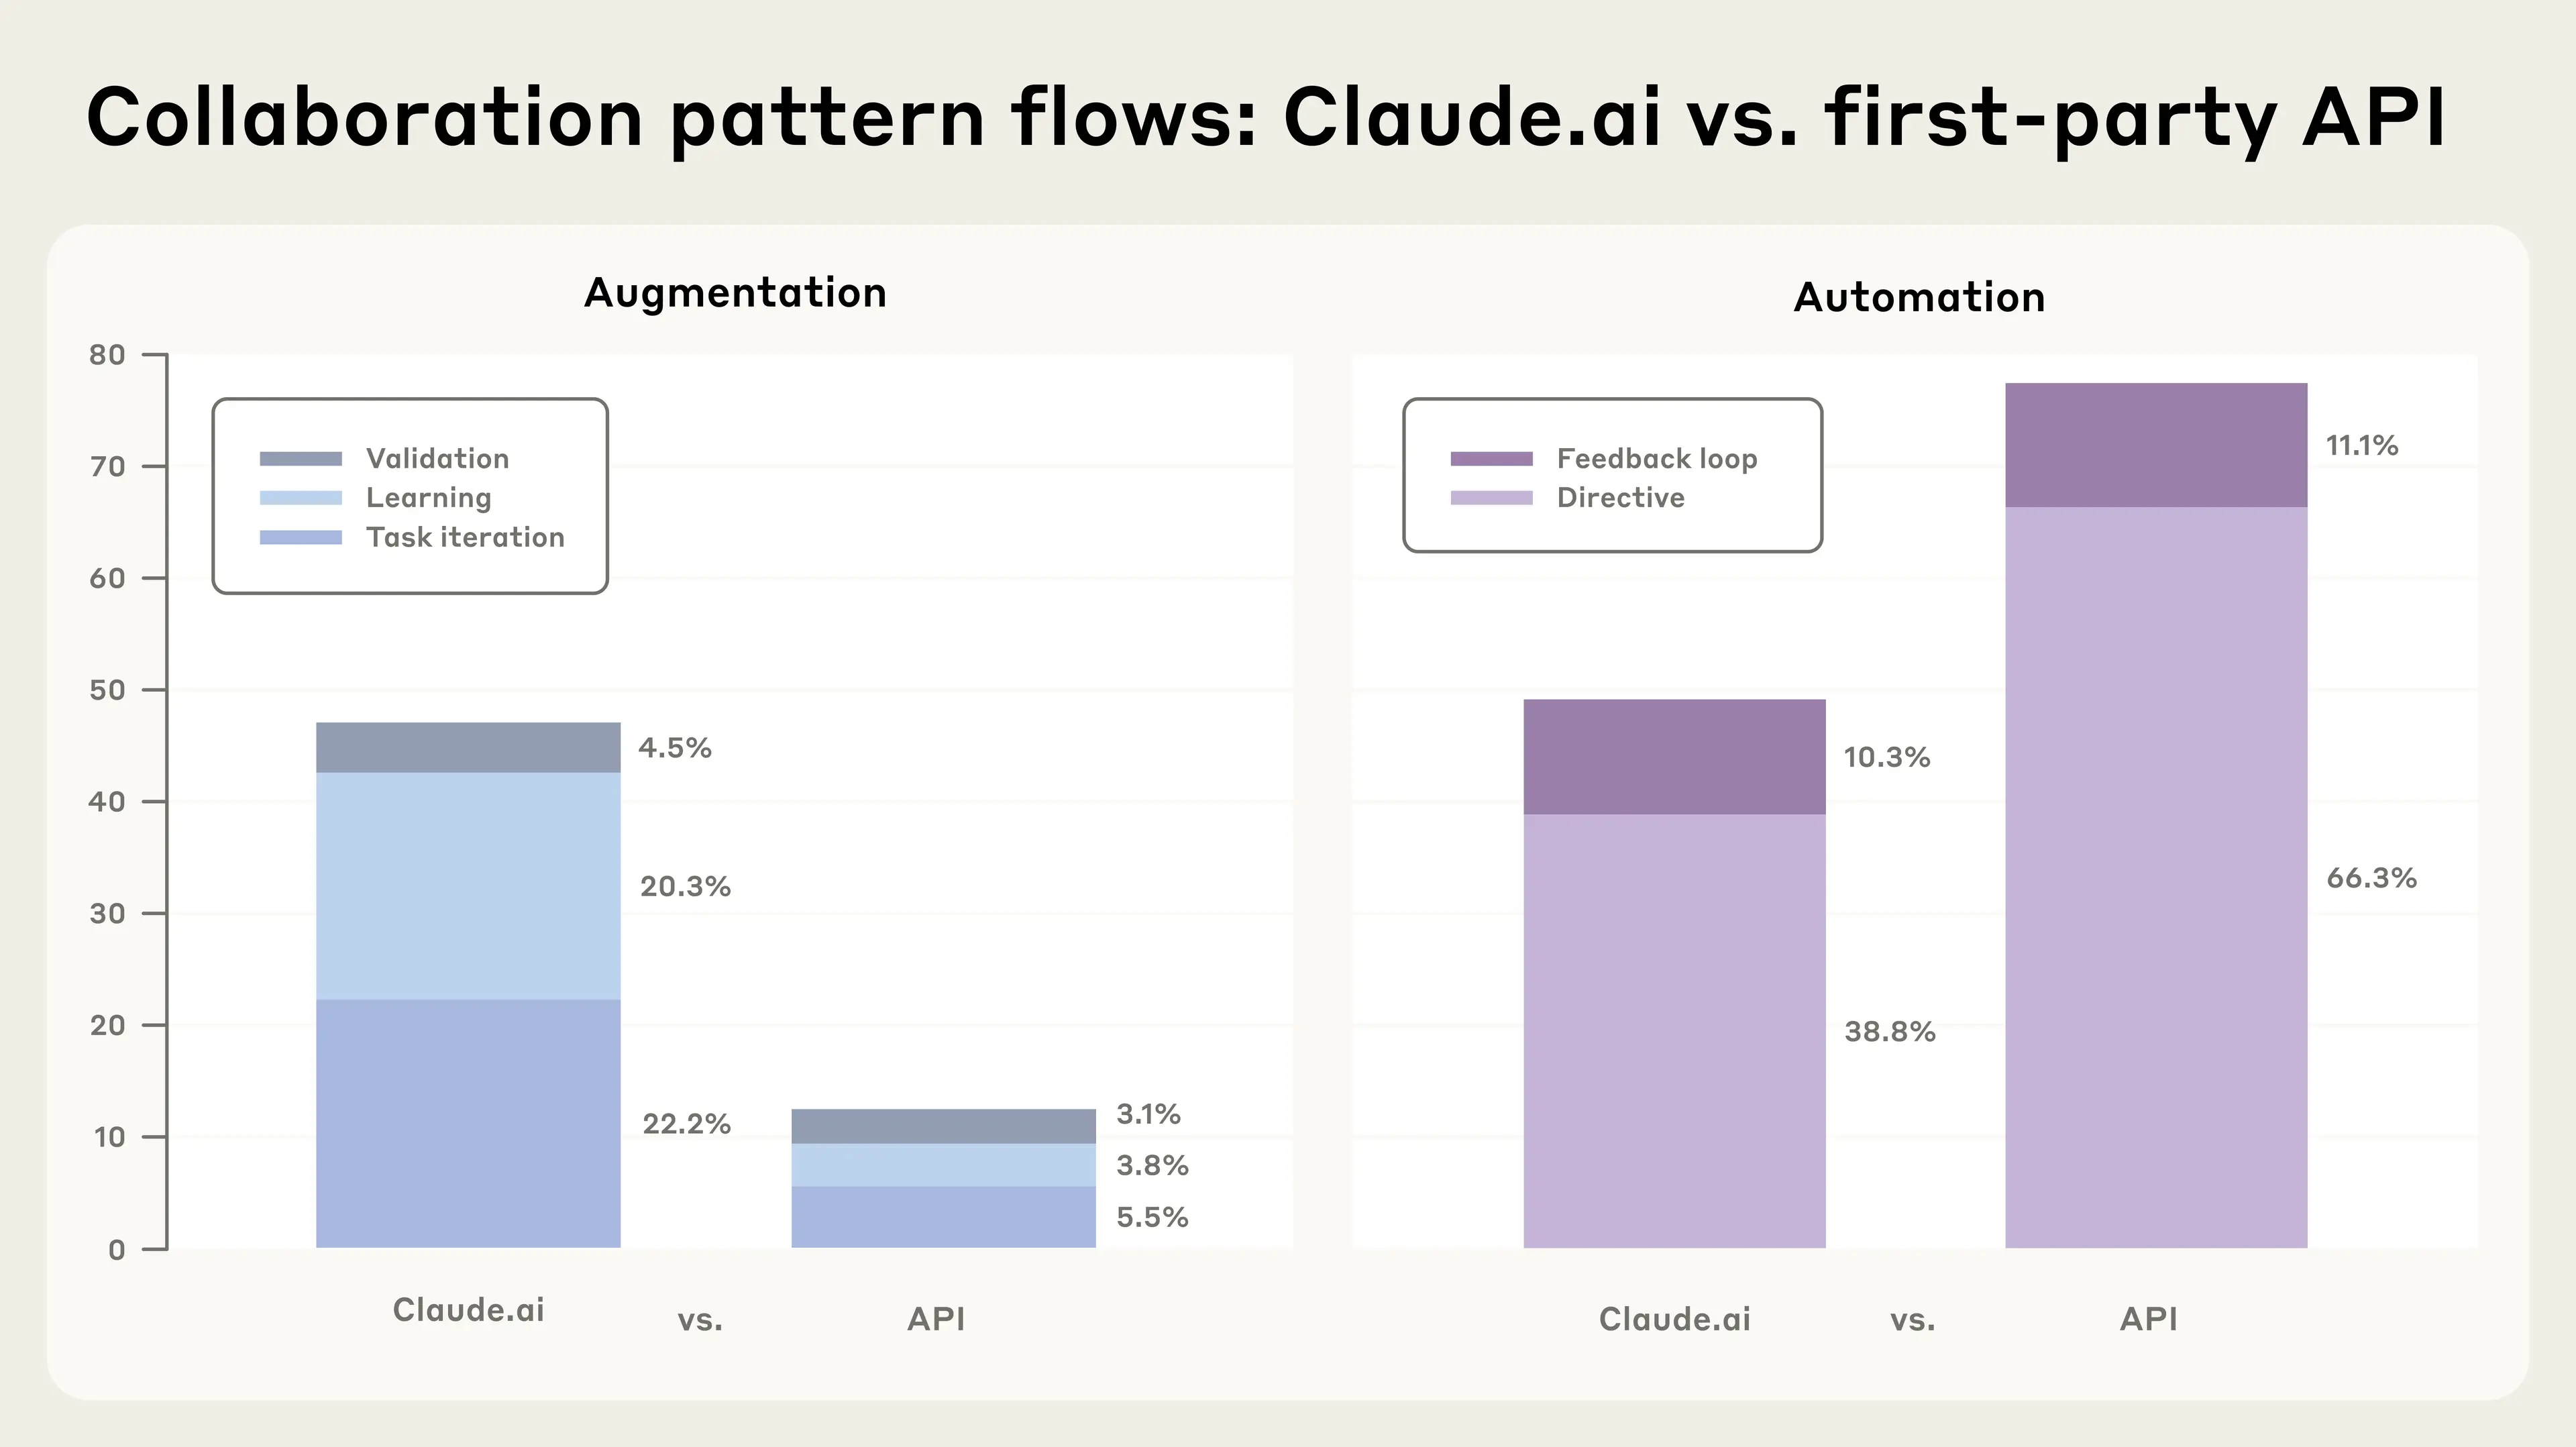
As we’ve discussed previously, we generally distinguish between tasks that involve automation (in which AI directly produces work with minimal user input) and augmentation (in which the user and AI collaborate to get things done). We further break automation down into directive and feedback loop interactions, where directive conversations involve the minimum of human interaction, and in feedback loop tasks, humans relay real-world outcomes back to the model. We also break augmentation down into learning (asking for information or explanations), task iteration (working with Claude collaboratively), and validation (asking for feedback).
Since December 2024, we’ve found that the share of directive conversations has risen sharply, from 27% to 39%. The shares of other interaction patterns (particularly learning, task iteration, and feedback loops) have fallen slightly as a result. This means that for the first time, automation (49.1%) has become more common than augmentation (47%) overall. One potential explanation for this is that AI is rapidly winning users’ confidence, and becoming increasingly responsible for completing sophisticated work.
This could be the result of improved model capabilities. (In December 2024, when we first collected data for the Economic Index, the latest version of Claude was Sonnet 3.6.) As models get better at anticipating what users want and at producing high-quality work, users are likely more willing to trust the model’s outputs at the first attempt.
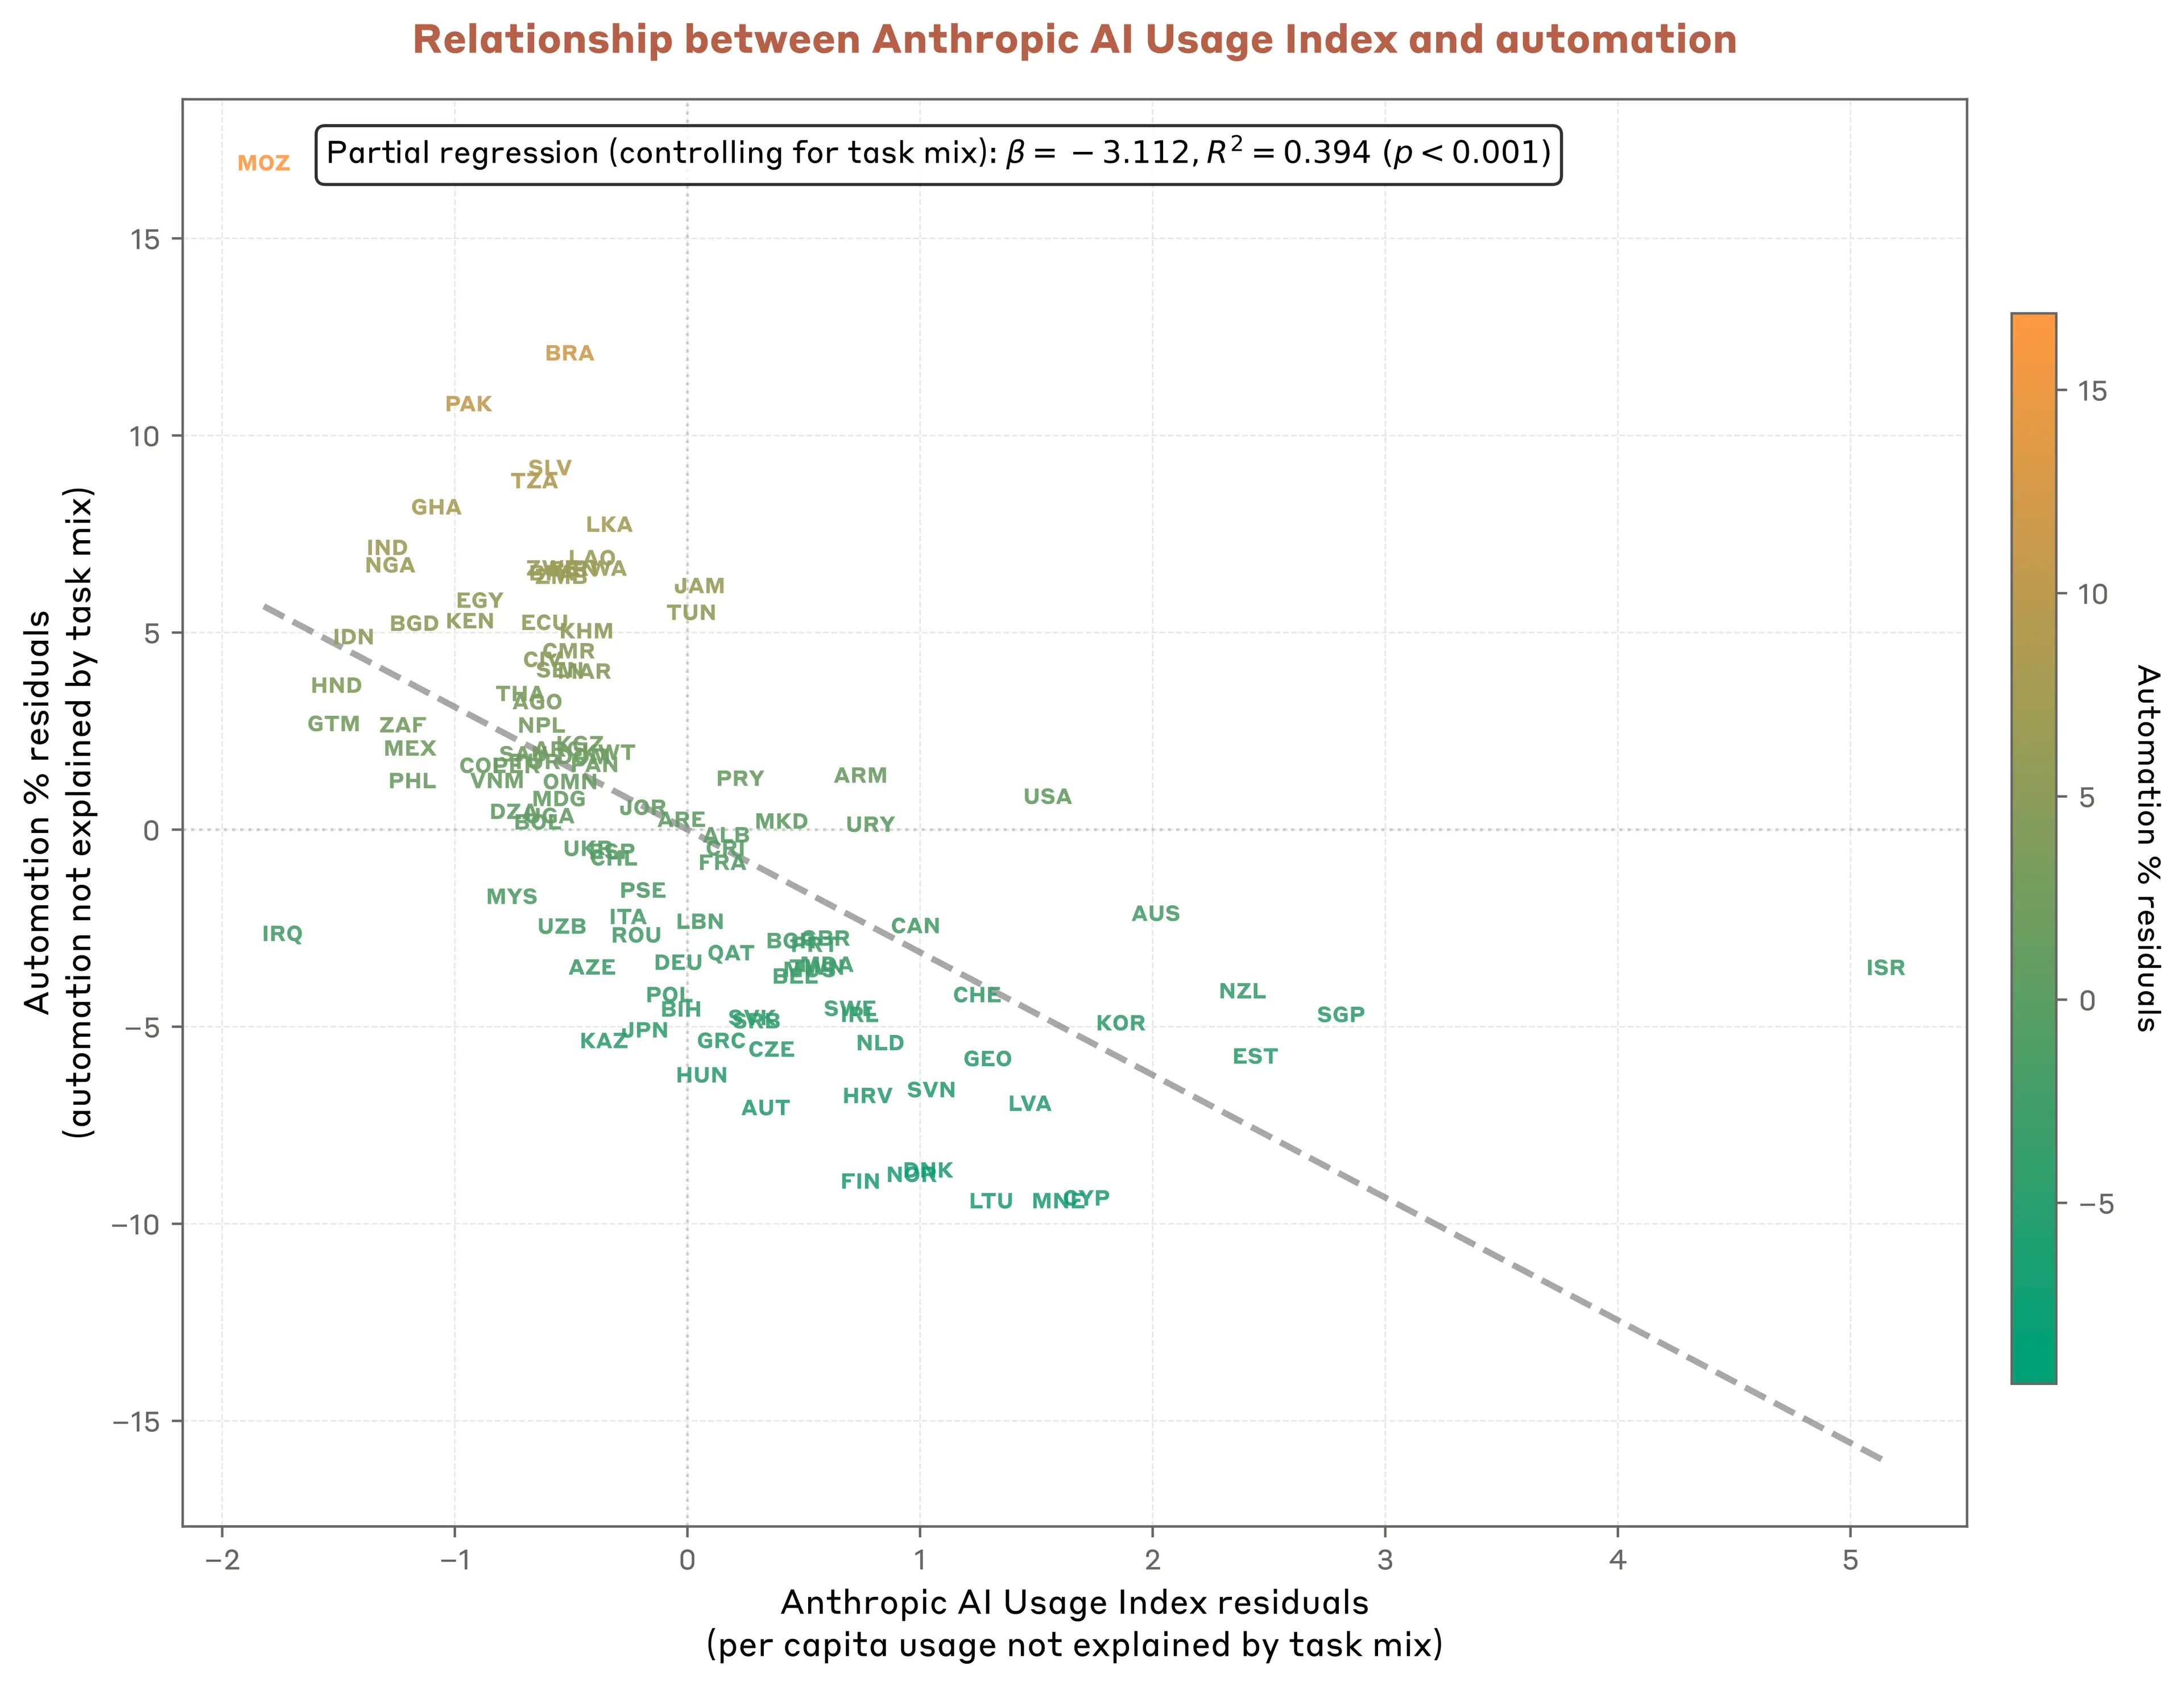
Perhaps surprisingly, in countries with higher Claude use per capita, Claude’s uses tend towards augmentation, whereas people in lower-use countries are much more likely to prefer automation. Controlling for the mix of tasks in question, a 1% increase in population-adjusted use of Claude is correlated with a roughly 3% reduction in automation. Similarly, increases in population-adjusted Claude use are associated with a shift away from automation (as in the chart below), not towards.
We’re not yet sure why this is. It could be because early adopters in each country feel more comfortable allowing Claude to automate tasks, or it could be down to other cultural and economic factors.
Businesses
Using the same privacy-preserving methodology we use for conversations on Claude.ai, we have begun sampling interactions from a subset of Anthropic’s first-party API customers, in a first-of-its-kind analysis.3 API customers, who tend to be businesses and developers, use Claude very differently to those who access it through Claude.ai: they pay per token, rather than a fixed monthly subscription, and can make requests through their own programs.
These customers’ use of Claude is especially concentrated in coding and administrative tasks: 44% of the API traffic in our sample maps to computer or mathematical tasks, compared to 36% of tasks on Claude.ai. (As it happens, around 5% of all API traffic focuses specifically on developing and evaluating AI systems.) This is offset by a smaller proportion of conversations related to educational occupations (4% in the API relative to 12% on Claude.ai), and arts and entertainment (5% relative to 8%).
We also find that our API customers use Claude for task automation much more often than Claude.ai users. 77% of our API conversations show automation patterns, of which the vast majority are directive, while just 12% show augmentation. On Claude.ai, the split is almost even. This could have significant economic implications: in the past, the automation of tasks has been associated with large economic transitions, as well as major productivity gains.
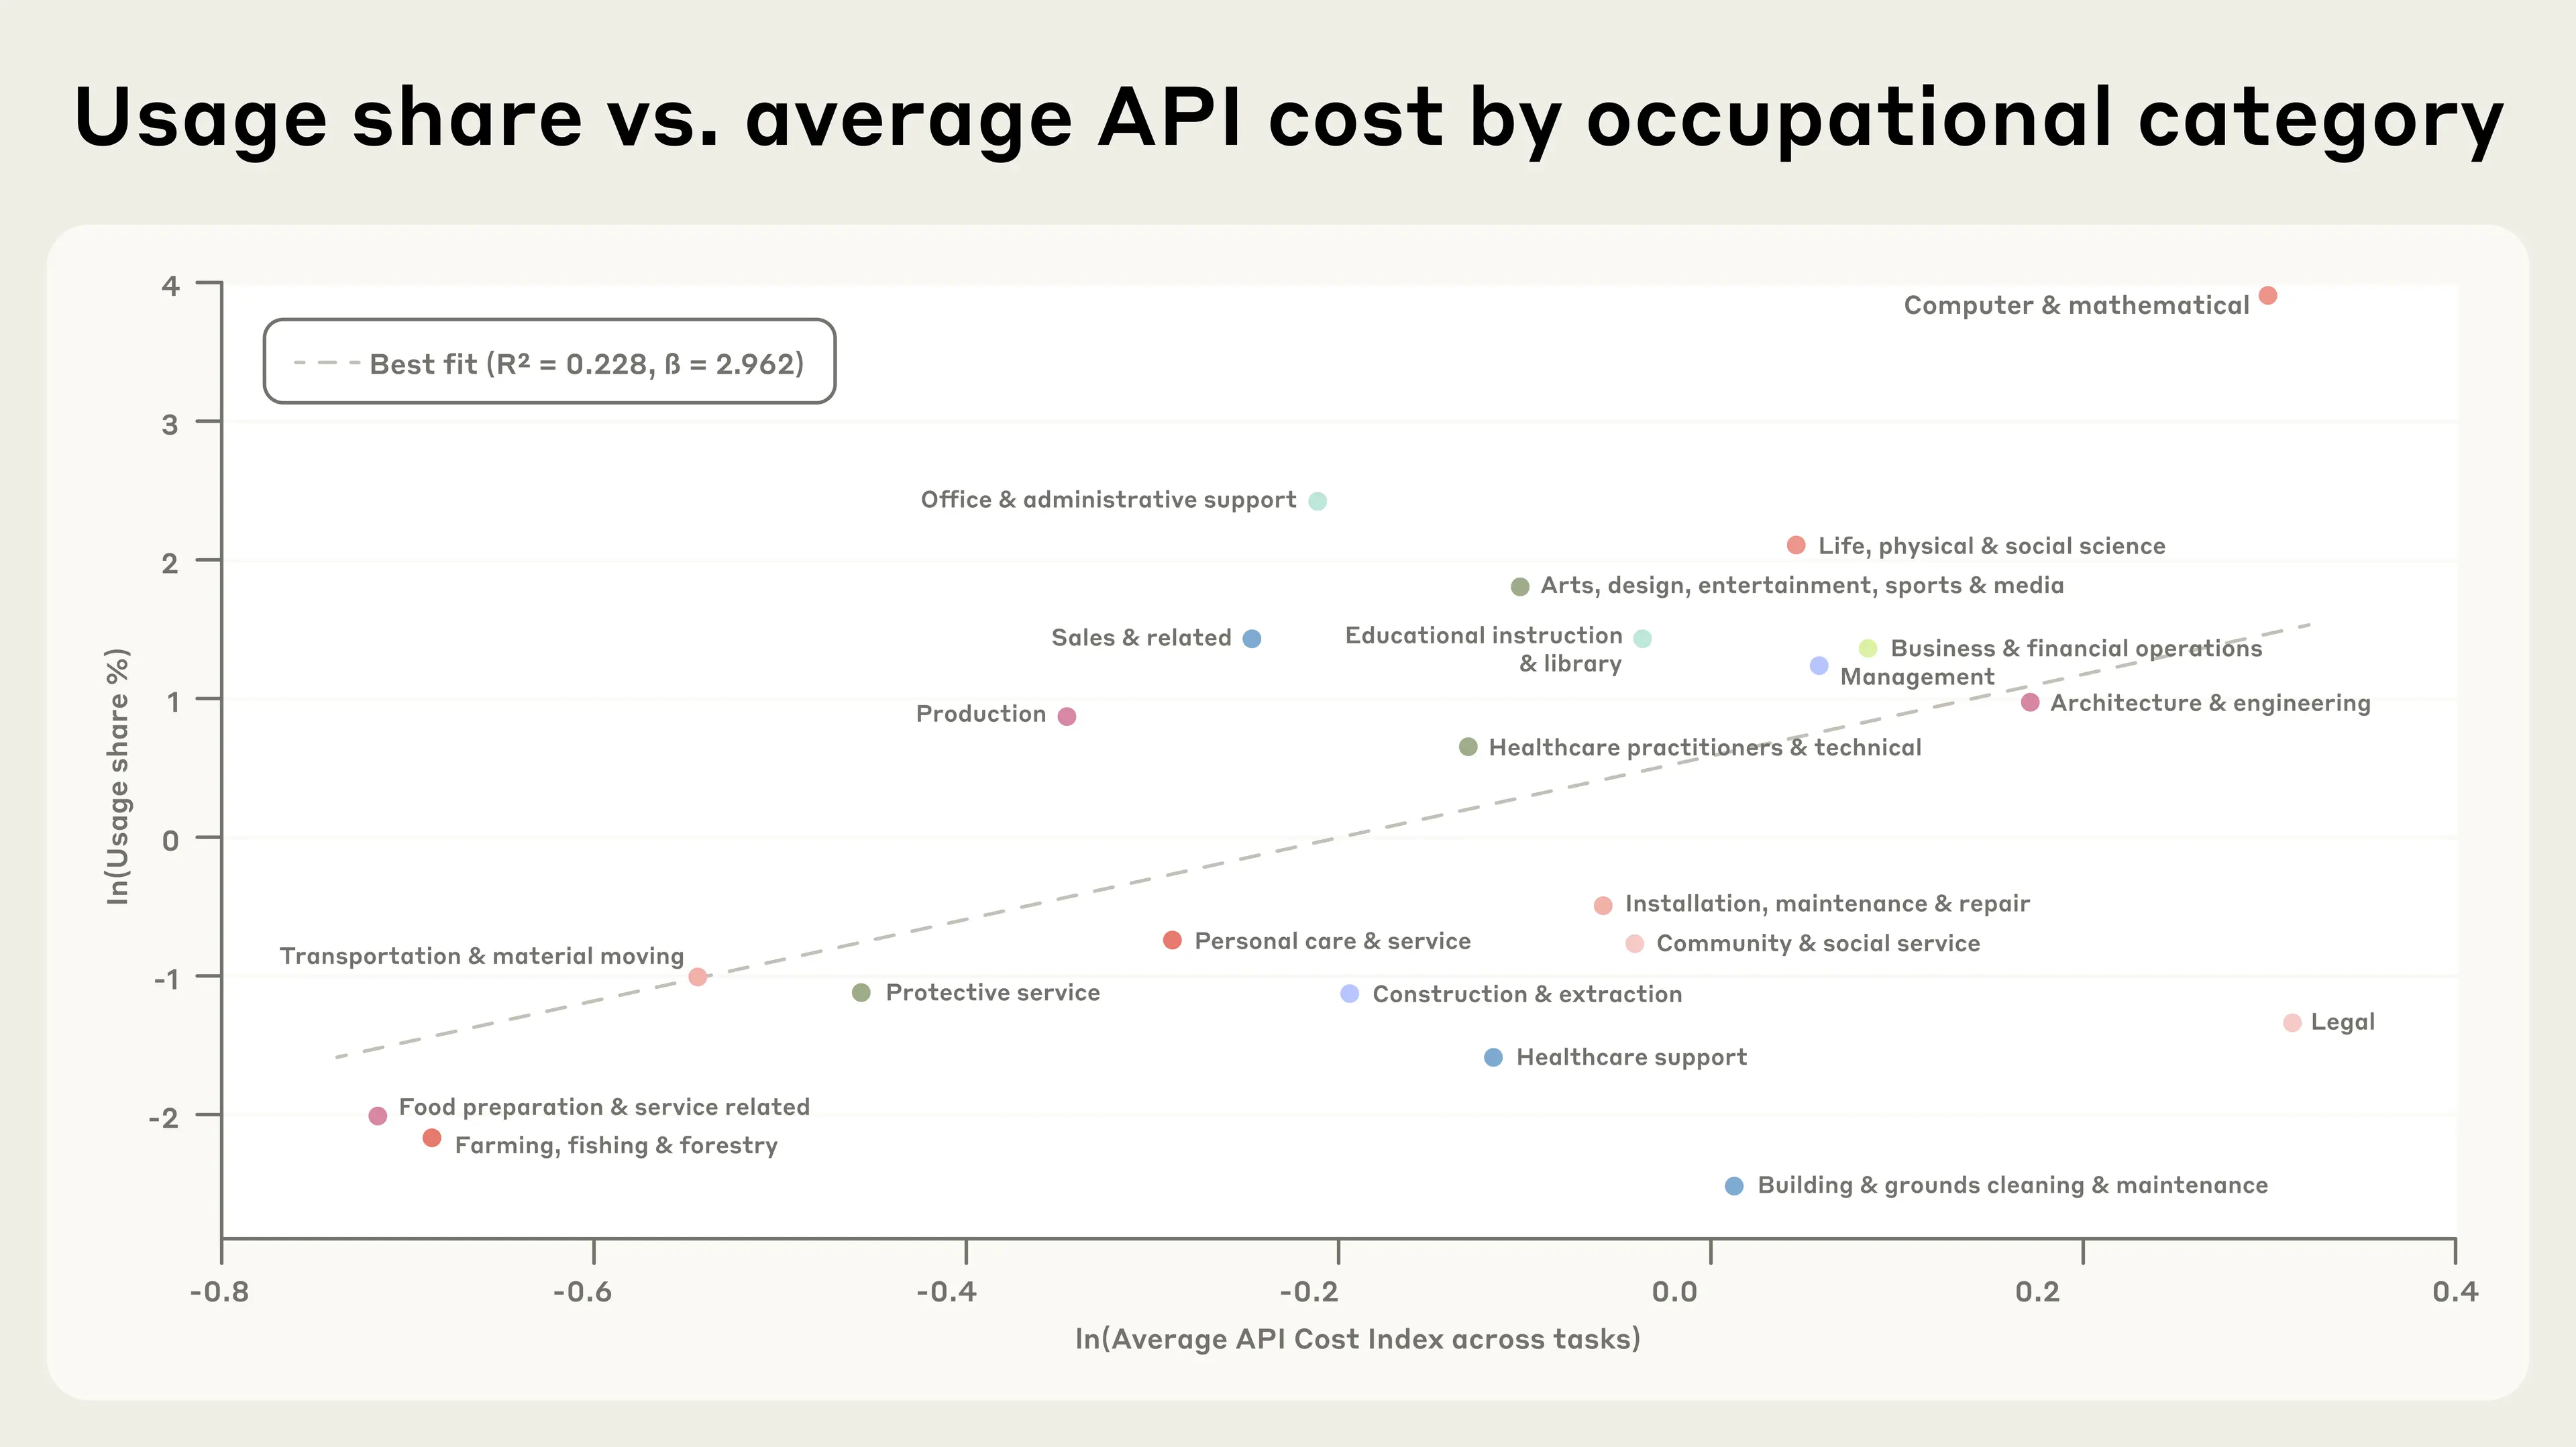
Finally, given how API use is paid for, we can also explore whether differences in the cost of tasks (caused by differences in the number of tokens they consume) affect which tasks businesses choose to “buy”. Here, we find a positive correlation between price and use: higher-cost task categories tend to see more frequent use, as in the graph below. This suggests to us that fundamental model capabilities, and the economic value generated by the models, matters more to businesses than the cost of completing the task itself.
Conclusion
The Economic Index is designed to provide an early, empirical assessment of how AI is affecting people’s jobs and the economy. What have we found so far?
Across each of the measures we cover in this report, the adoption of AI appears remarkably uneven. People in higher-income countries are more likely to use Claude, more likely to seek collaboration rather than automation, and more likely to pursue a breadth of uses beyond coding. Within the US, AI use seems to be strongly influenced by the dominant industries in local economies, from technology to tourism. And businesses are more likely to entrust Claude with agency and autonomy than consumers are.
Beyond the fact of unevenness, it’s especially notable to us that directive automation has become much more common in conversations on Claude.ai over the past nine months. The nature of people’s use of Claude is evidently still being defined: we’re still collectively deciding how much confidence we have in AI tools, and how much responsibility we should give them. So far, though, it looks like we’re becoming increasingly comfortable with AI, and willing to let it work on our behalf. We’re looking forward to revisiting this analysis over time, to see where—or, indeed, if—users’ choices settle as AI models improve.
If you’d like to explore our data yourself, you can do so on our dedicated Anthropic Economic Index website, which contains interactive visualizations of our country, state, and occupational data. We’ll update this website with more data in future, so you can continue to track the evolution of AI’s effects on jobs and the economy in the ways that interest you.
Our full report is available here. We hope it helps policymakers, economists and others more effectively prepare for the economic opportunities and risks that AI provides.
Open data
As with our past reports, we're releasing a comprehensive dataset for this release, including geographic data, task-level use patterns, automation/augmentation breakdowns by task, and an overview of API use. Data are available for download at the Anthropic Economic Index website.
Work with us
If you’re interested in working at Anthropic to help build the systems powering this research, we encourage you to apply for our Research Engineer role.
Footnotes
1. As for Utah, in second: when further investigating Utah’s activity, we discovered that a notable fraction of its use appeared to be associated with indicators of coordinated abuse – which is also reflected in Utah’s much higher “directive” automation score than average. However, we ran robustness checks and believe that this activity is not driving the results.
2. We supplement this with a ‘bottom-up’ task classification in which Claude classifies conversations according to its own taxonomy, in order to address any gaps in the O*NET categories. The full details of our privacy-preserving analysis methodology are available here.
3. Data in this section covers 1 million transcripts from August 2025, sampled randomly from a pool of 1P API customers constituting roughly half of our 1P API usage. We continue to manage data according to our privacy and retention policies, and our analysis is consistent with our terms, policies, and contractual agreements.
Related content
Discovering cryptographic weaknesses with Claude
cryptographic algorithms. The first attack significantly weakens HAWK, a digital signature scheme that was built for a future world where quantum computers are able to break existing standards. The second identifies a new way to attack round-reduced AES, the most widely used symmetric cipher.
Read moreProject Pilot: Can AI control a drone?
Working with Andon Labs, we’ve developed a new series of evaluations that assess AI models’ ability to use a flying drone, culminating in a new benchmark: Drone-Bench.
Read more