Anthropic Economic Index: Insights from Claude 3.7 Sonnet
Last month, we launched the Anthropic Economic Index—a new initiative where we’re regularly releasing data and research aimed at understanding AI's effects on labor markets and the economy over time.
Today, we’re releasing our second research report from the Index, covering usage data on Claude.ai following the launch of Claude 3.7 Sonnet—our newest and most capable model with strengths in agentic coding and a new “extended thinking” mode.
Briefly, our latest results are the following:
- Since the launch of Claude 3.7 Sonnet, we’ve observed a rise in the share of usage for coding, as well as educational, science, and healthcare applications;
- People use Claude 3.7 Sonnet’s new “extended thinking” mode predominantly for technical tasks, including those associated with occupations like computer science researchers, software developers, multimedia animators, and video game designers;
- We're releasing data on augmentation / automation breakdowns on a task- and occupation-level. For example, tasks associated with copywriters and editors show the highest amount of task iteration, where the human and model co-write something together. By contrast, tasks associated with translators and interpreters show among the highest amounts of directive behavior—where the model completes the task with minimal human involvement.
In addition, we’re releasing a first-of-its-kind bottom-up taxonomy of usage on Claude.ai. This new dataset covers 630 granular categories ranging from “Help resolve household plumbing, water, and maintenance issues” to “Provide guidance on battery technologies and charging systems.” We hope this bottom-up taxonomy will be useful for researchers, and reveal use-cases that might be missed by top-down approaches which map usage onto a list of predefined tasks.
The datasets for these analyses are freely available to download.
Read on for more details on our findings.
What’s changed since the launch of Claude 3.7 Sonnet?
Last month, we introduced Claude 3.7 Sonnet, our most capable model yet with an “extended thinking mode”. We reran our previous analysis on data from the 11 days following the launch, covering 1 million anonymized Claude.ai Free and Pro conversations. The vast majority of the data we analyzed was from Claude 3.7 Sonnet, as it is set as the default on Claude.ai and our mobile app.
As a reminder, our privacy-preserving analysis tool, Clio, maps each conversation to one of 17,000 tasks in the U.S. Department of Labor’s O*NET database. We then look at the overall patterns in the occupations and high-level occupational categories associated with those tasks.
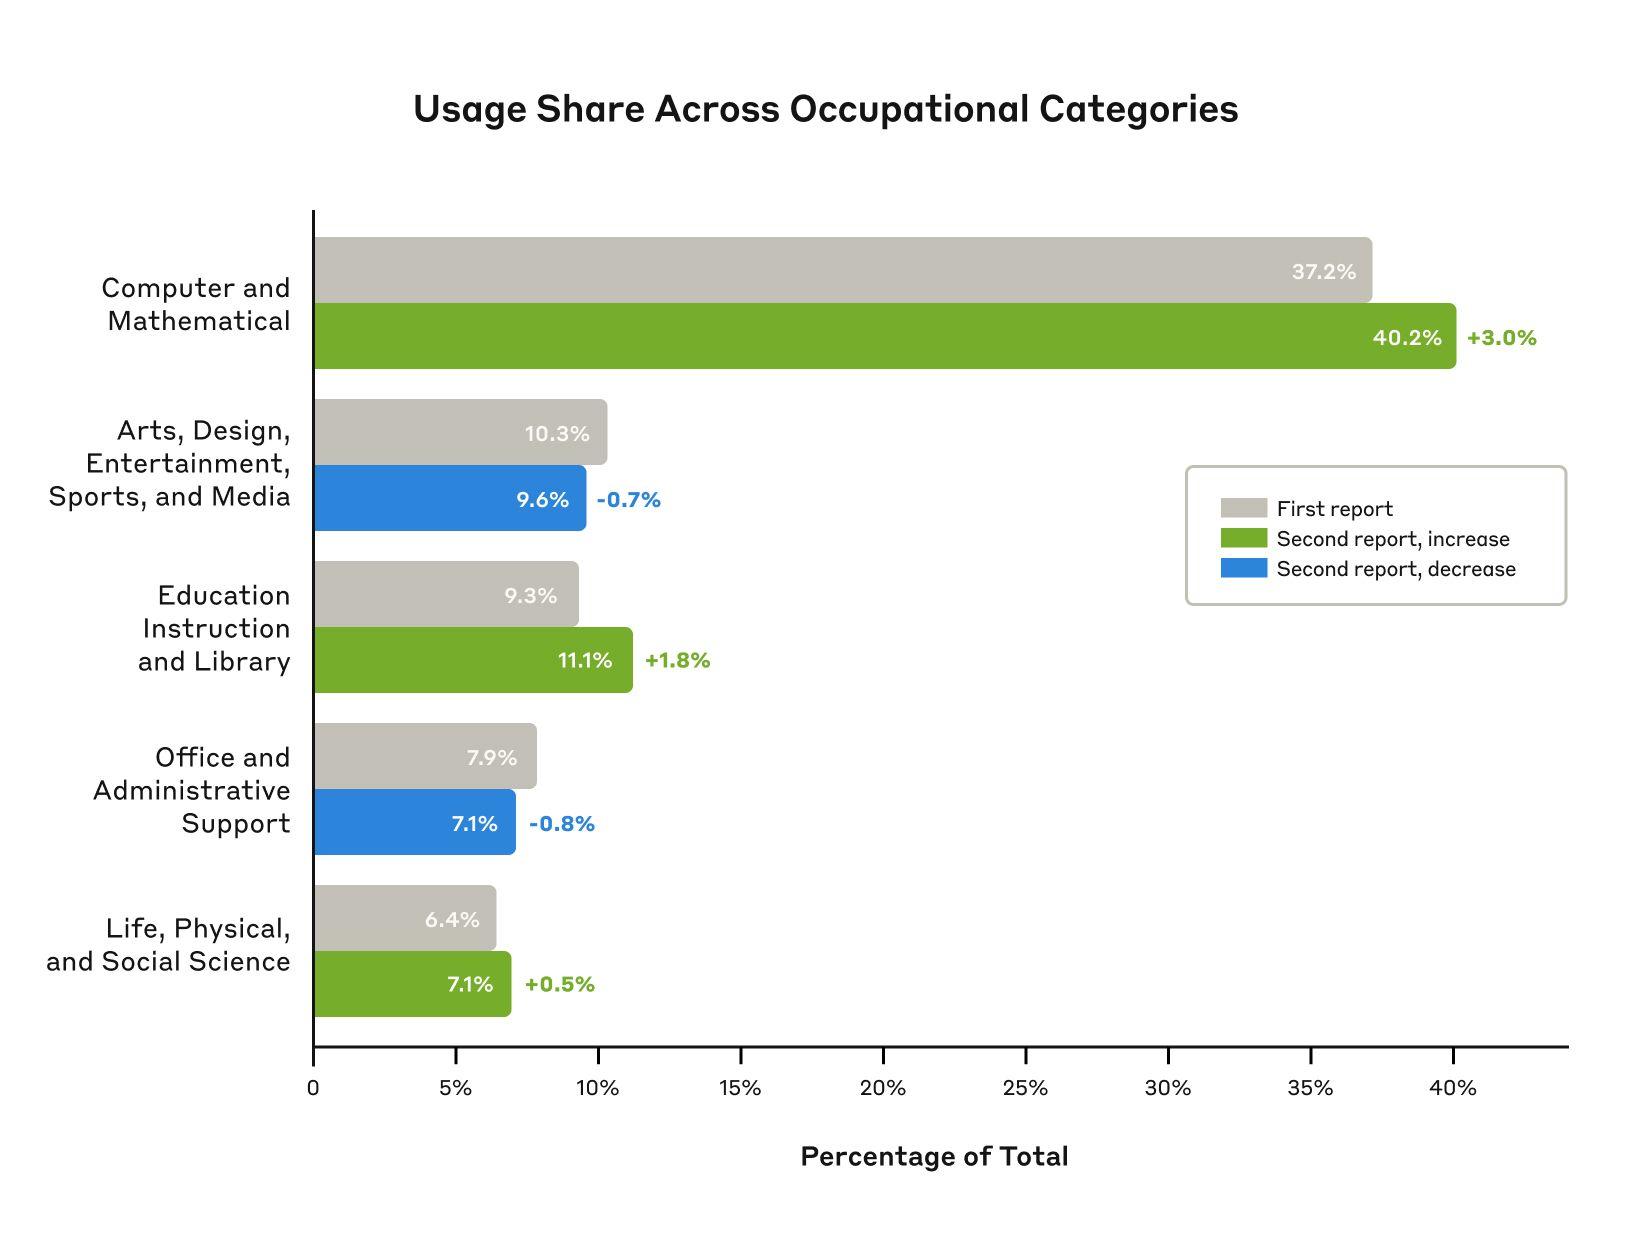
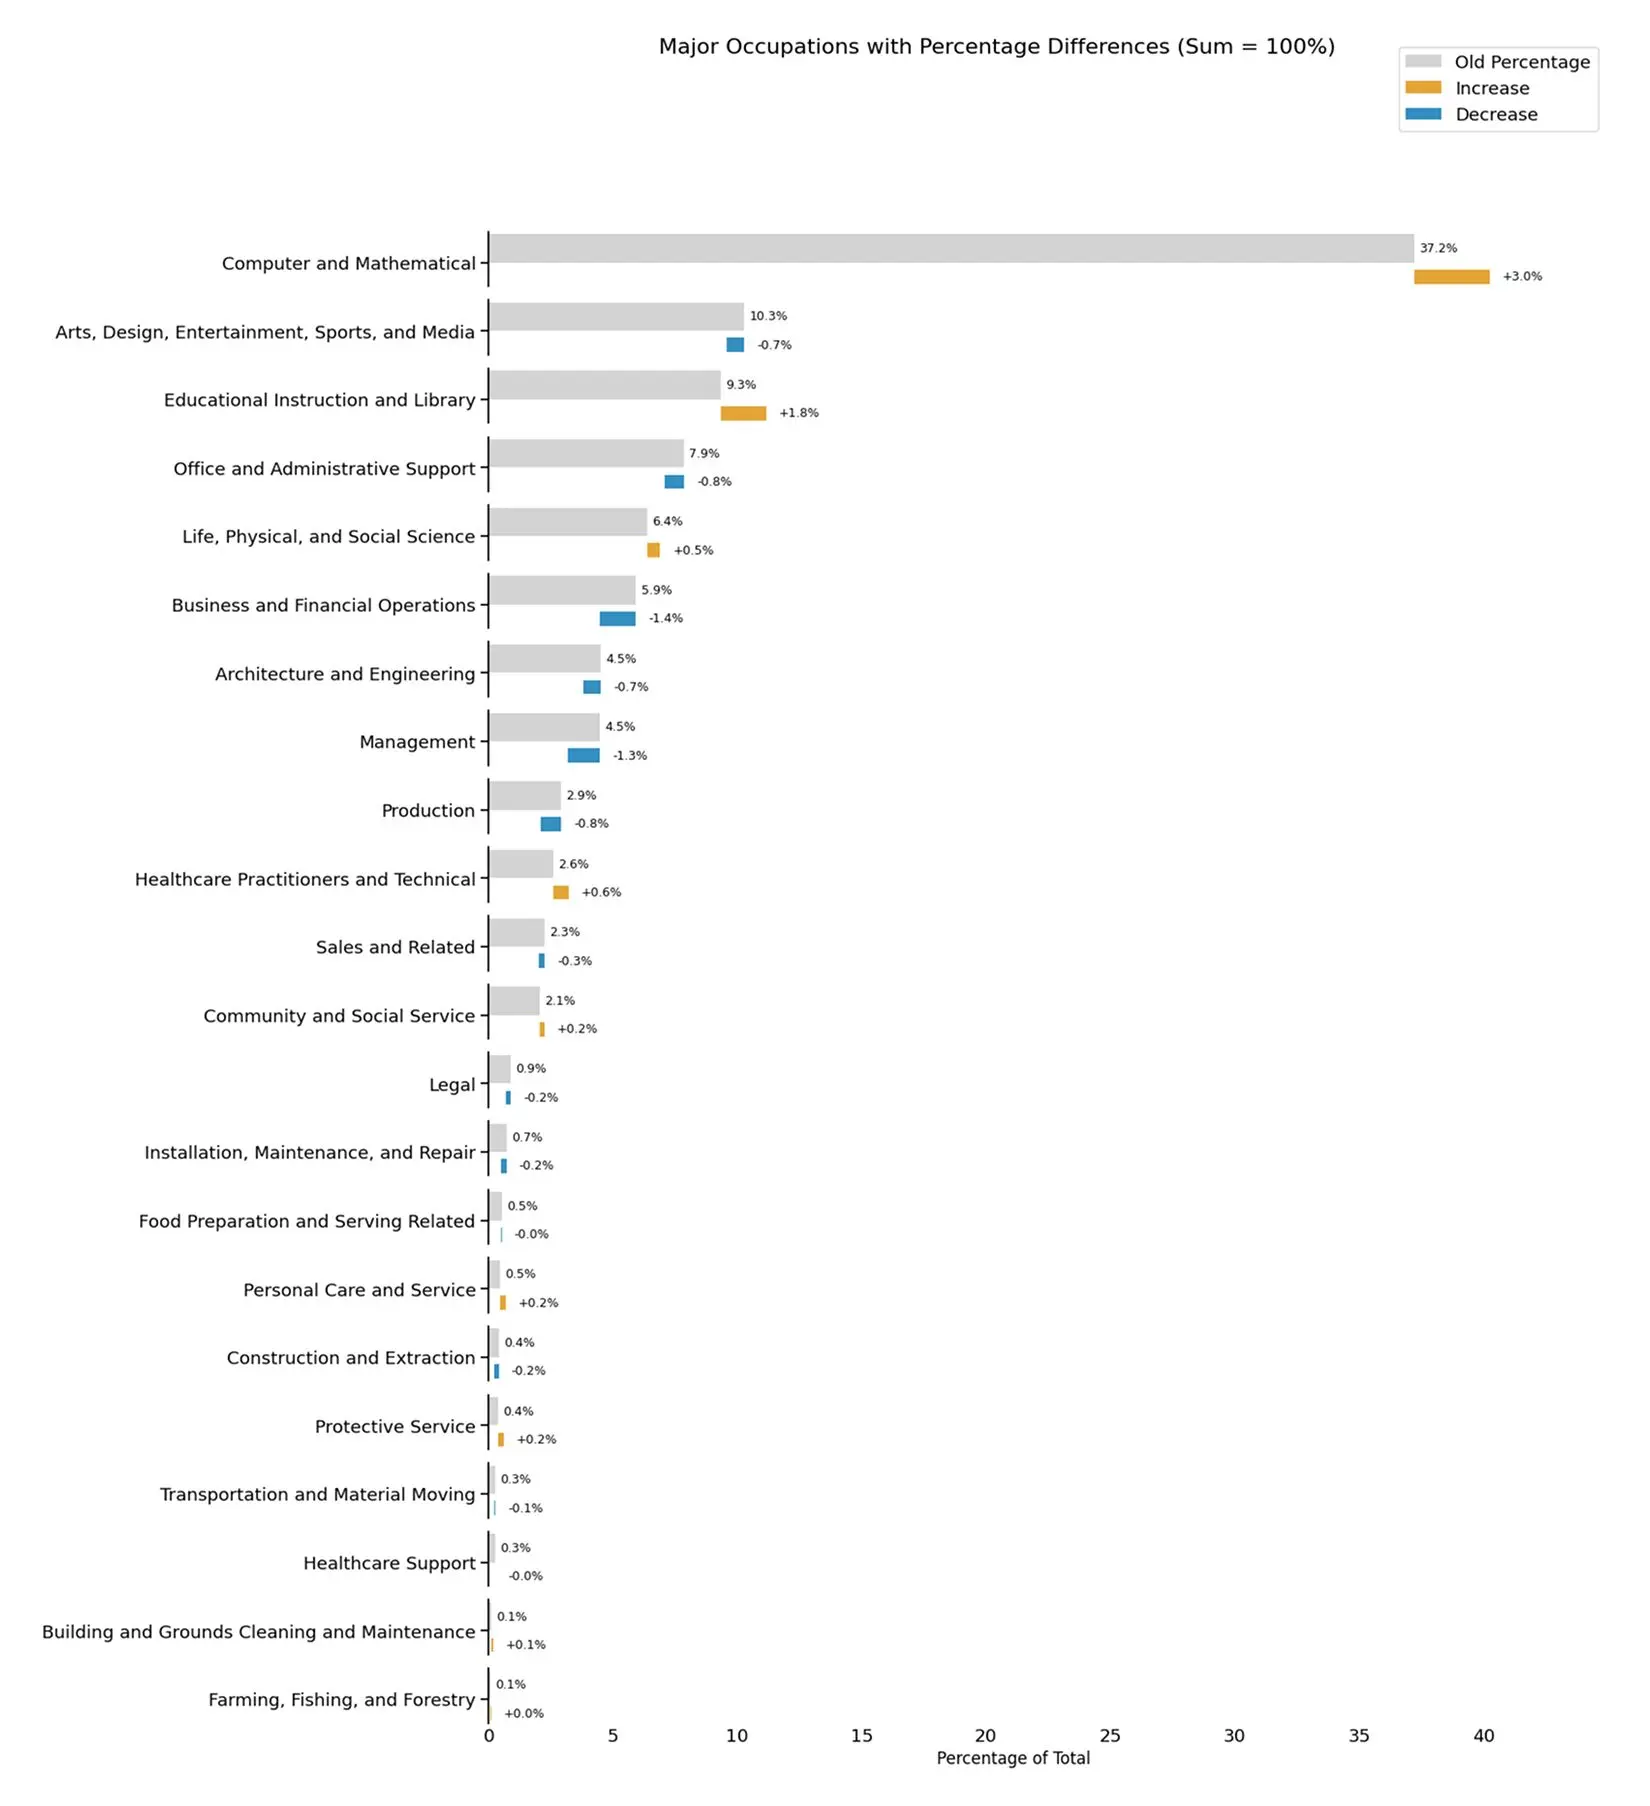
When looking at the breakdown of these 1 million conversations, we see that the proportion of usage in several occupational categories has increased modestly, including coding, education and the sciences. While this increase in coding usage was expected due to Claude 3.7 Sonnet’s improved scores on coding benchmarks, the increase in these other categories could reflect either ongoing diffusion of AI throughout the economy, novel applications of coding to those domains, or unexpected capability improvements in the model.
How are people using extended thinking mode?
Claude 3.7 Sonnet features a new “extended thinking” mode which, when activated by the user, enables the model to think for longer when answering more complex questions.
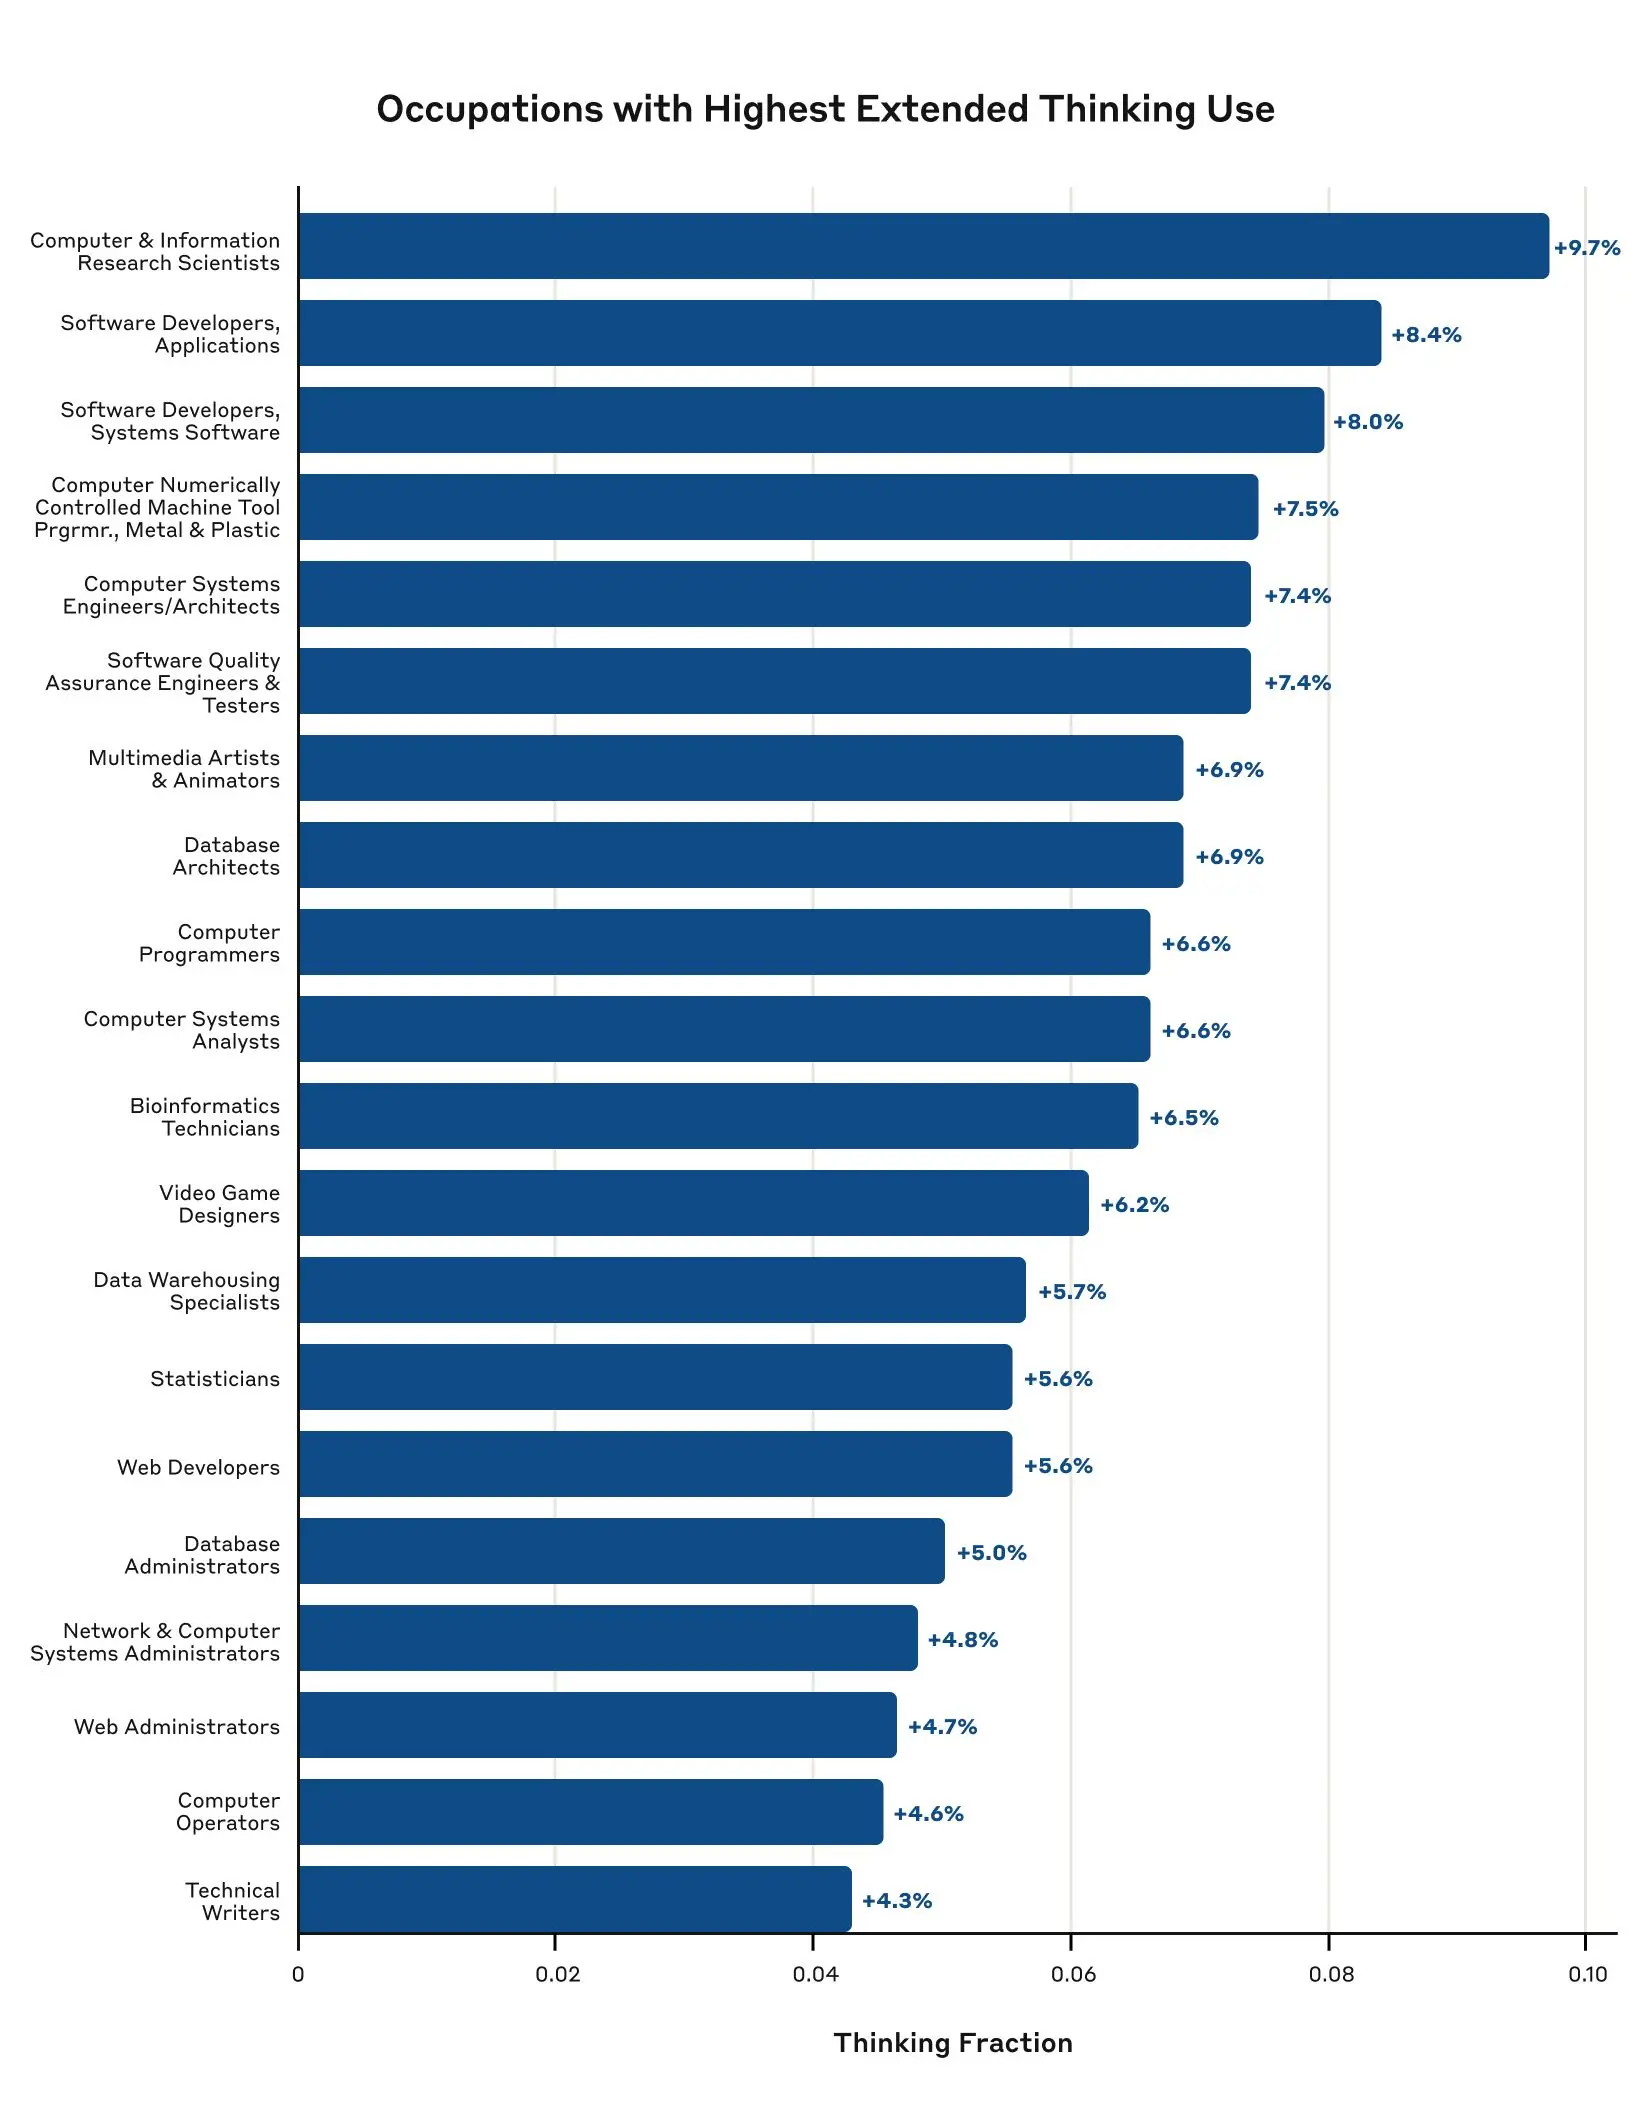
Our analysis reveals that Claude 3.7 Sonnet's extended thinking mode is predominantly used in technical and creative problem-solving contexts. Tasks associated with computer and information research scientists lead with almost 10% using extended thinking, followed by software developers at around 8%. Tasks associated with digital creative roles like multimedia artists (~7%) and video game designers (~6%) also show substantial usage.
While these early usage patterns reveal insights about when people choose to use extended thinking mode, many important questions remain about this new model capability. To enable further research in this space, we’re releasing a new dataset that maps each O*NET task to its associated thinking mode fraction. This dataset is available on our Hugging Face page.
How does augmentation vs. automation vary by task and occupation?
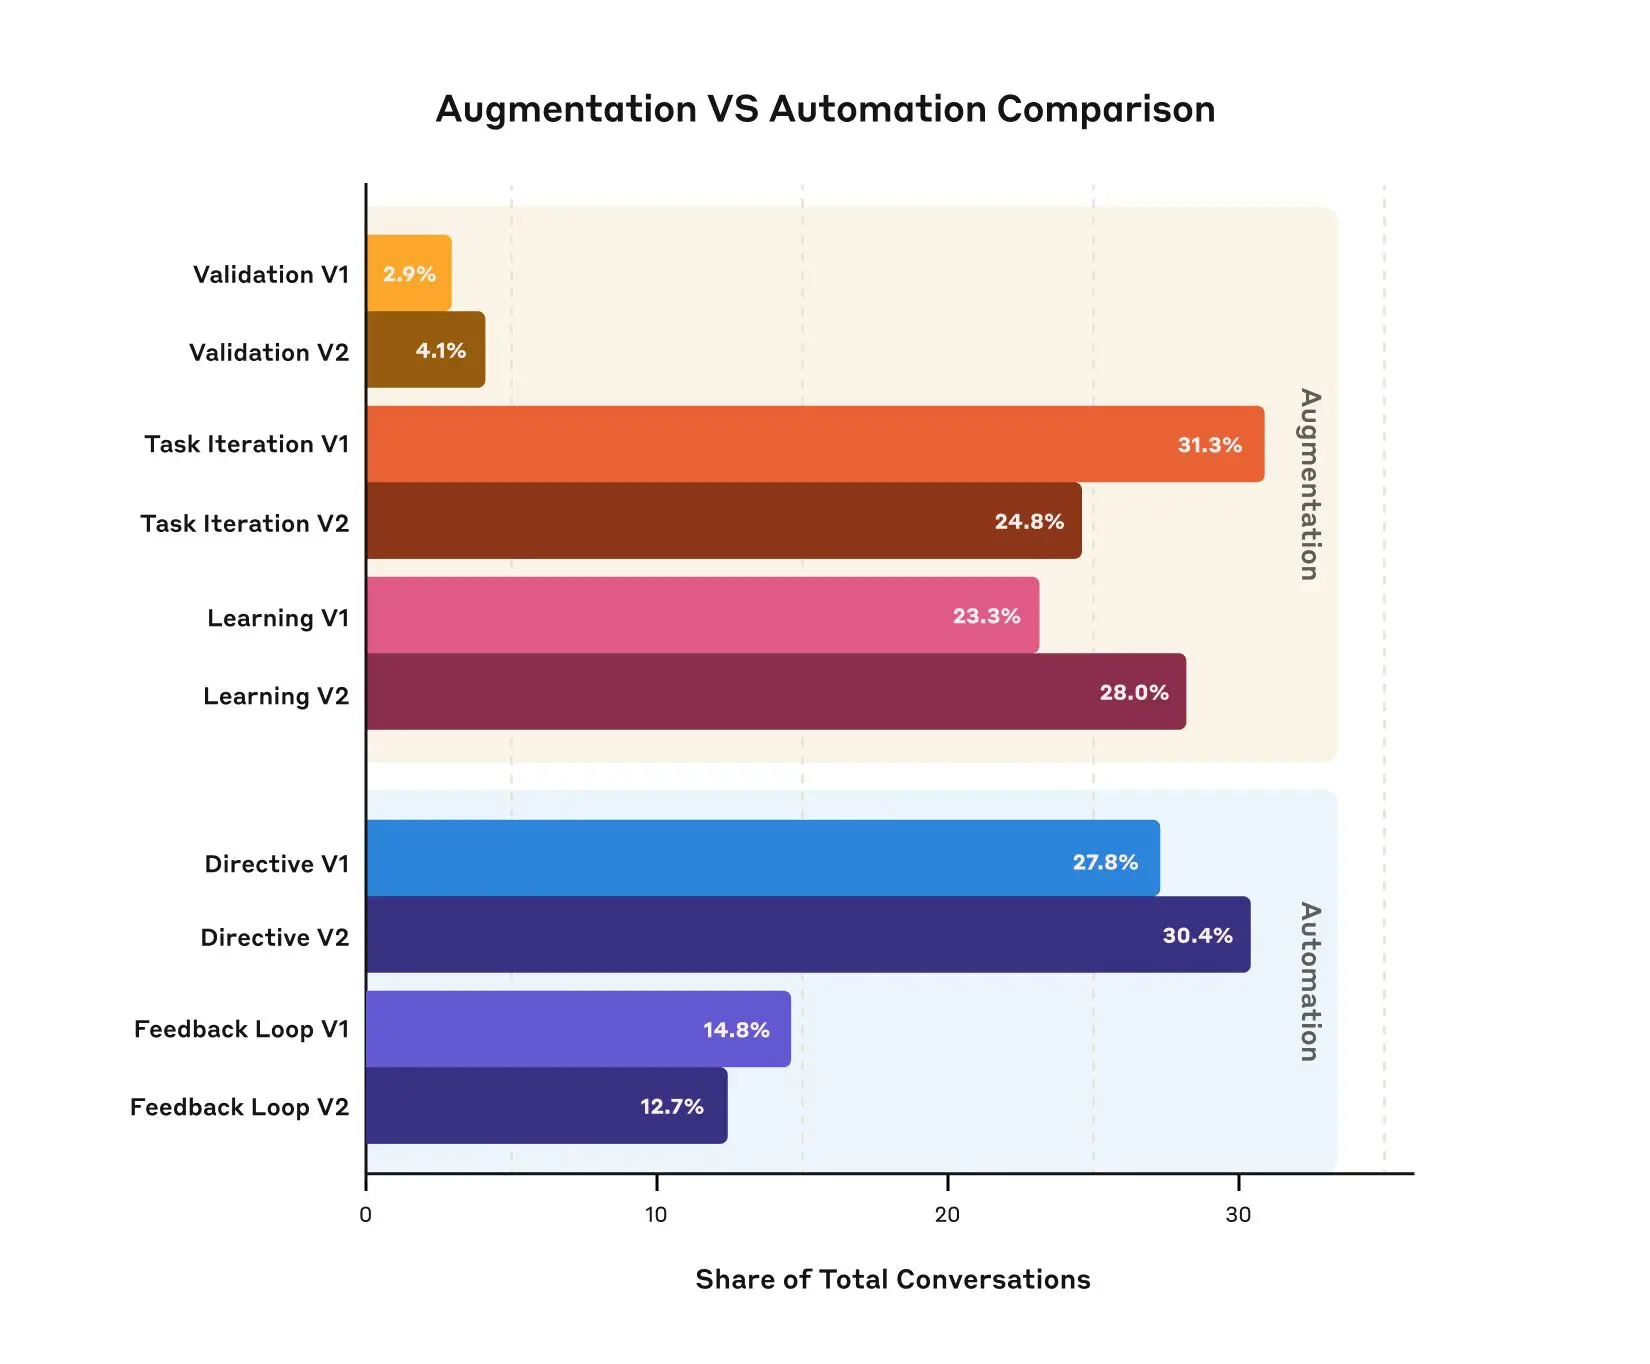
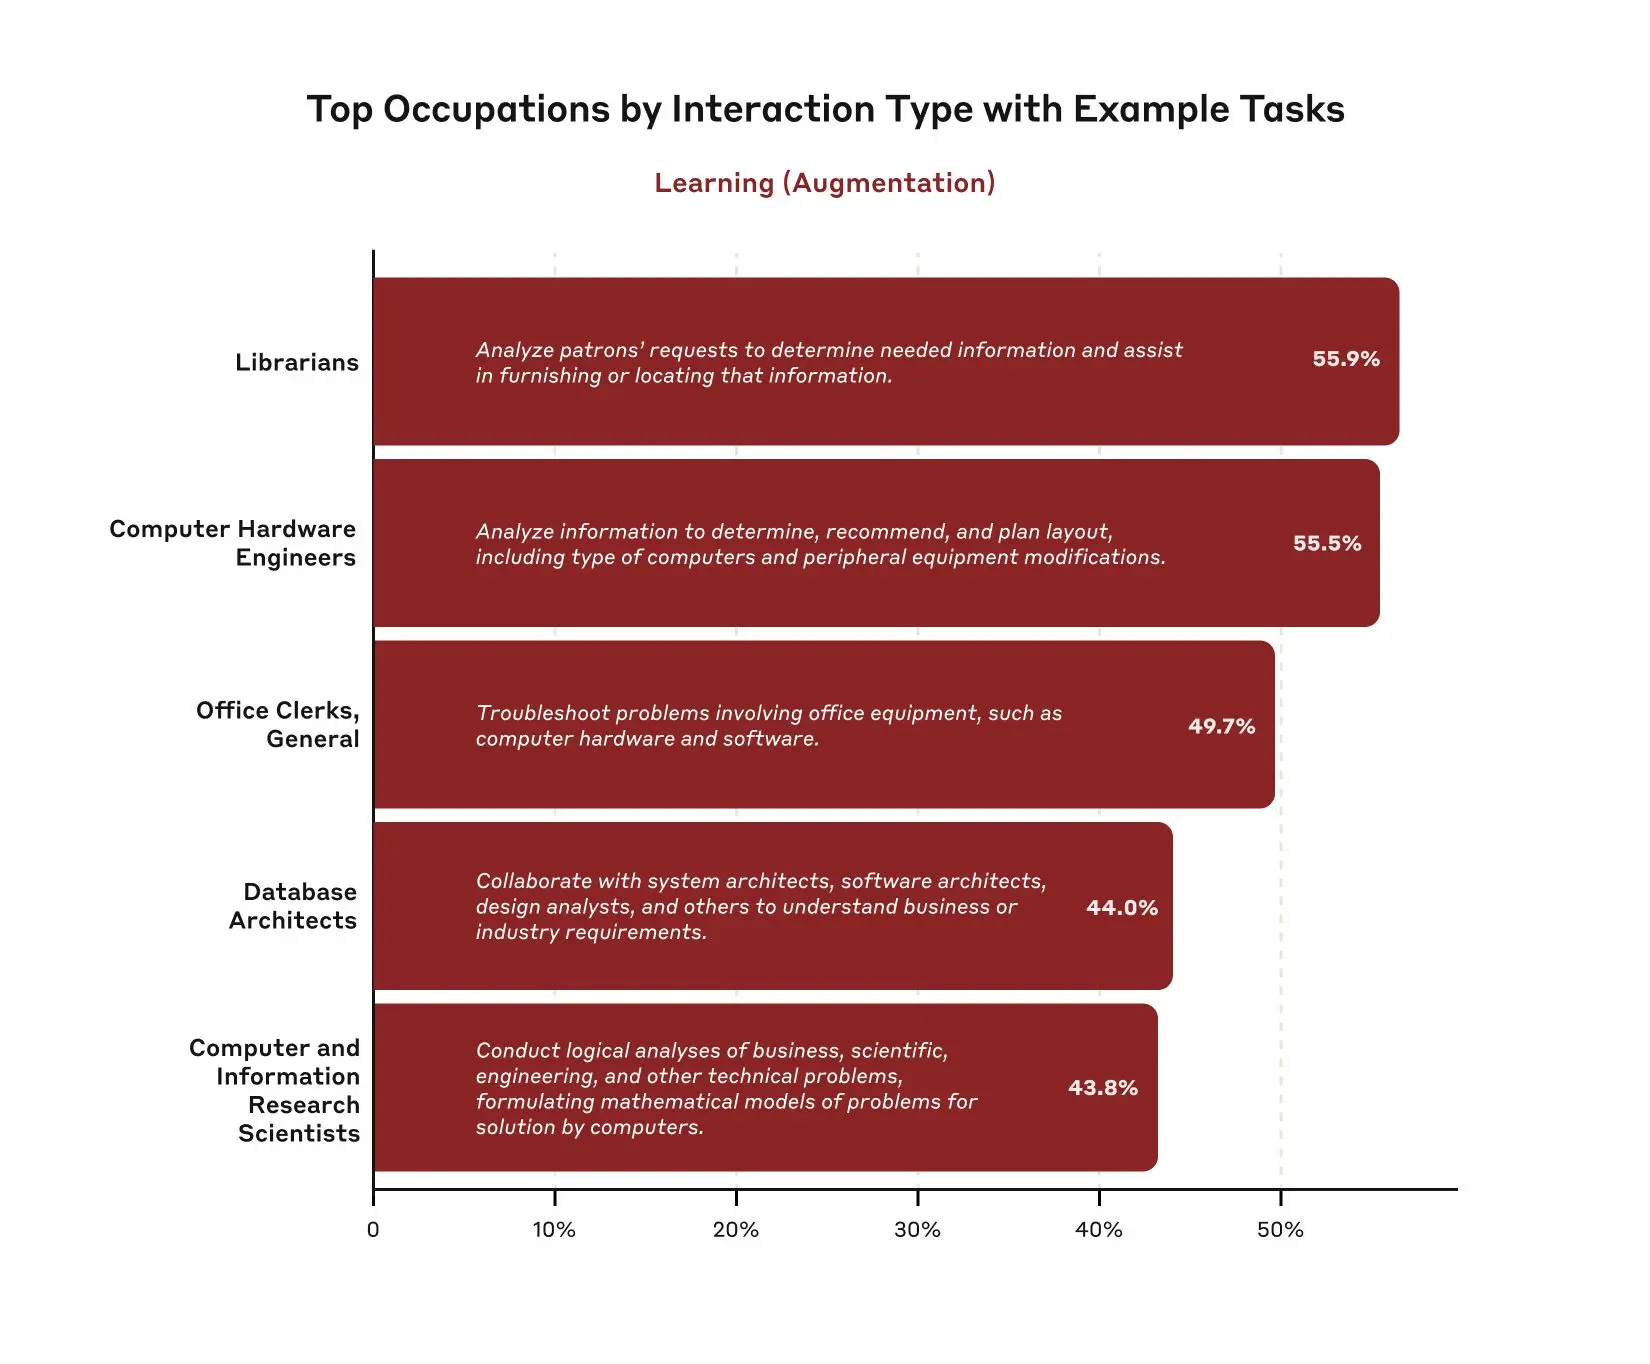
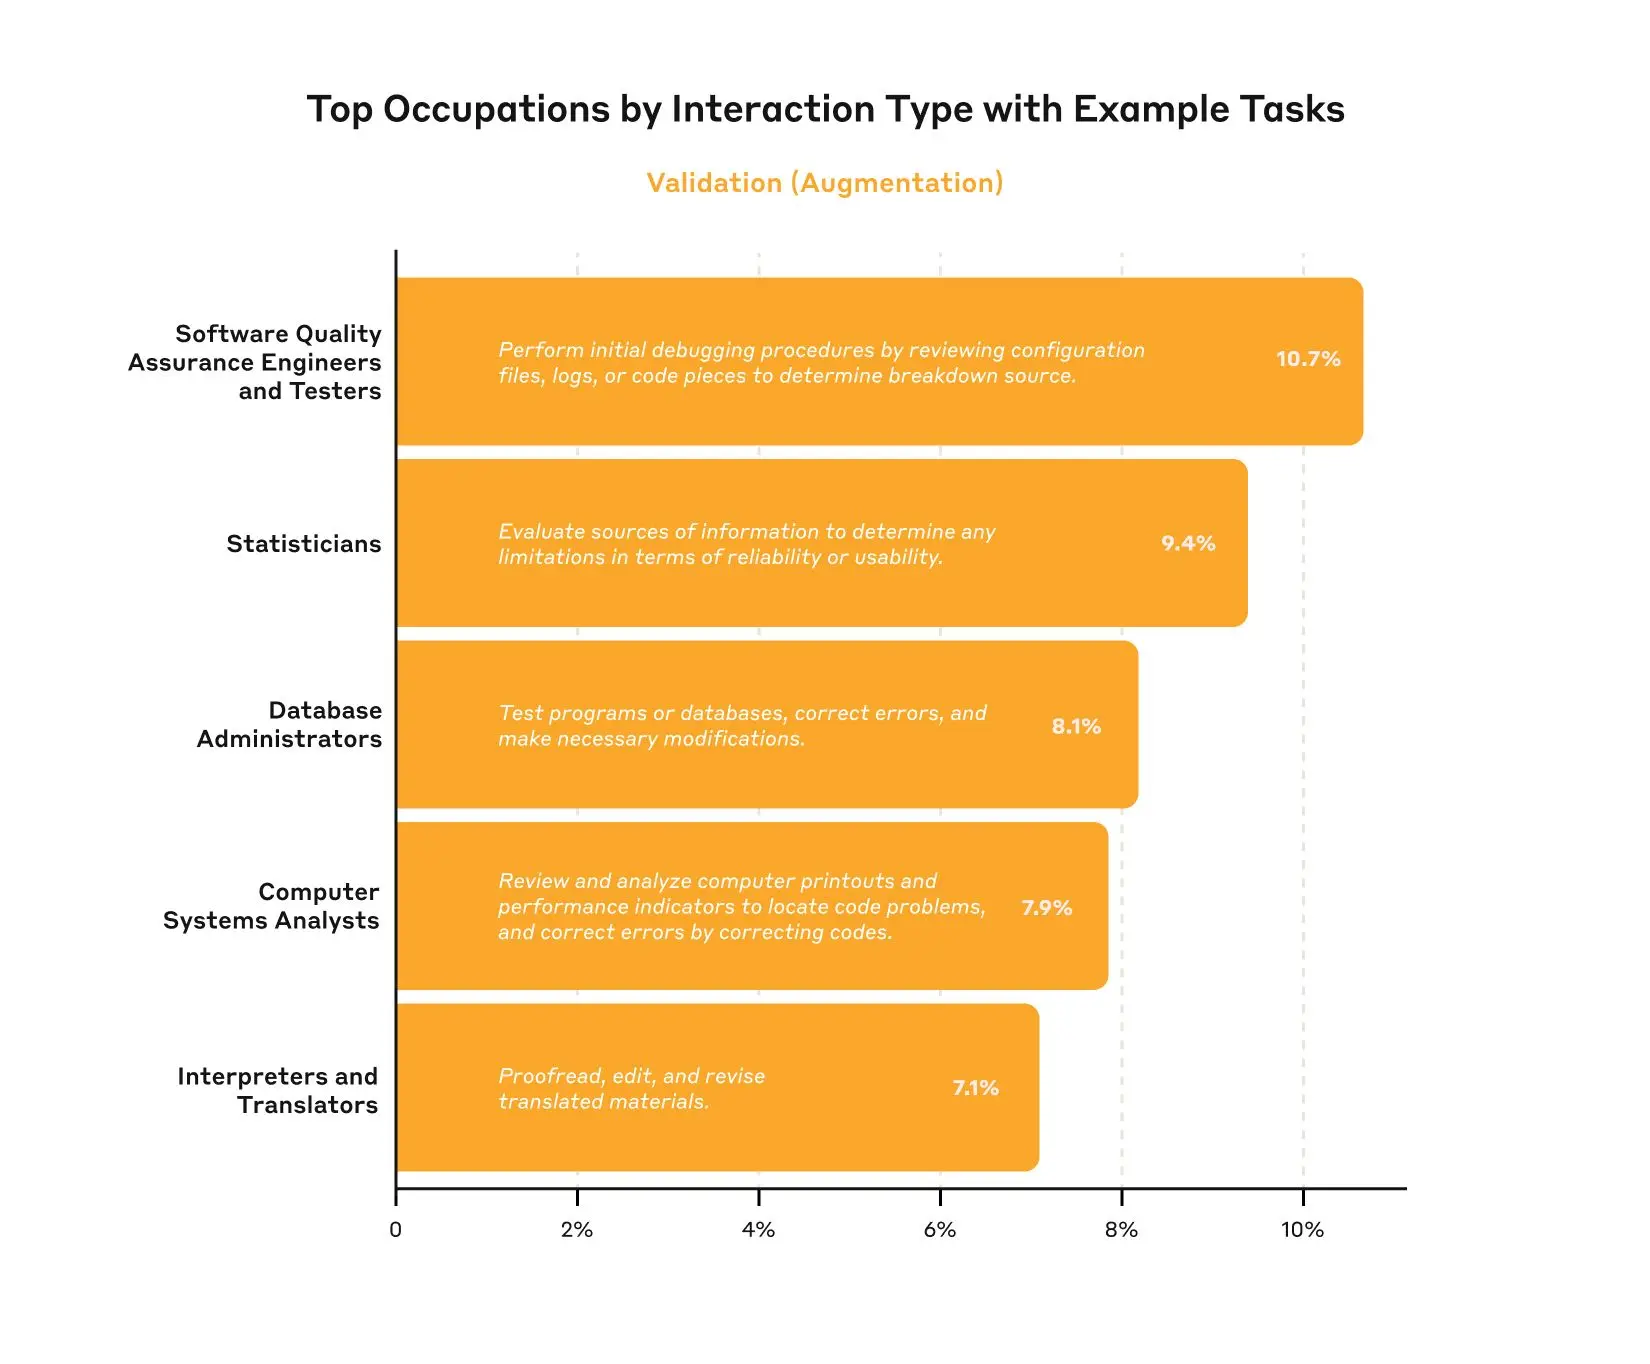
In our last report, we analyzed how AI usage varied between augmentative uses, like learning or iterating on an output, and automative uses, like asking the model to directly complete a task or debug errors. Our analysis shows the balance of augmentation and automation is essentially unchanged in our new data, with augmentation still comprising 57% of usage. However, we did see some change in types of automation and augmentation uses—for example, we saw learning interactions, where the user asks Claude for information or explanation about different topics, rise from ~23% to ~28%.
We received a number of requests via our researcher input form to release automation and augmentation data at the level of tasks and occupations. We do just that in this report, providing this data on our Hugging Face page.
When splitting the data by high-level occupational categories, we find some categories are highly augmentative; for example, Community and Social Service tasks, which includes education and guidance counseling, approach 75% augmentation. At the other end of the extreme, tasks associated with production or computer and mathematical occupations, we see the balance skew closer to 50-50%. We don’t see any occupational categories where automation dominates.
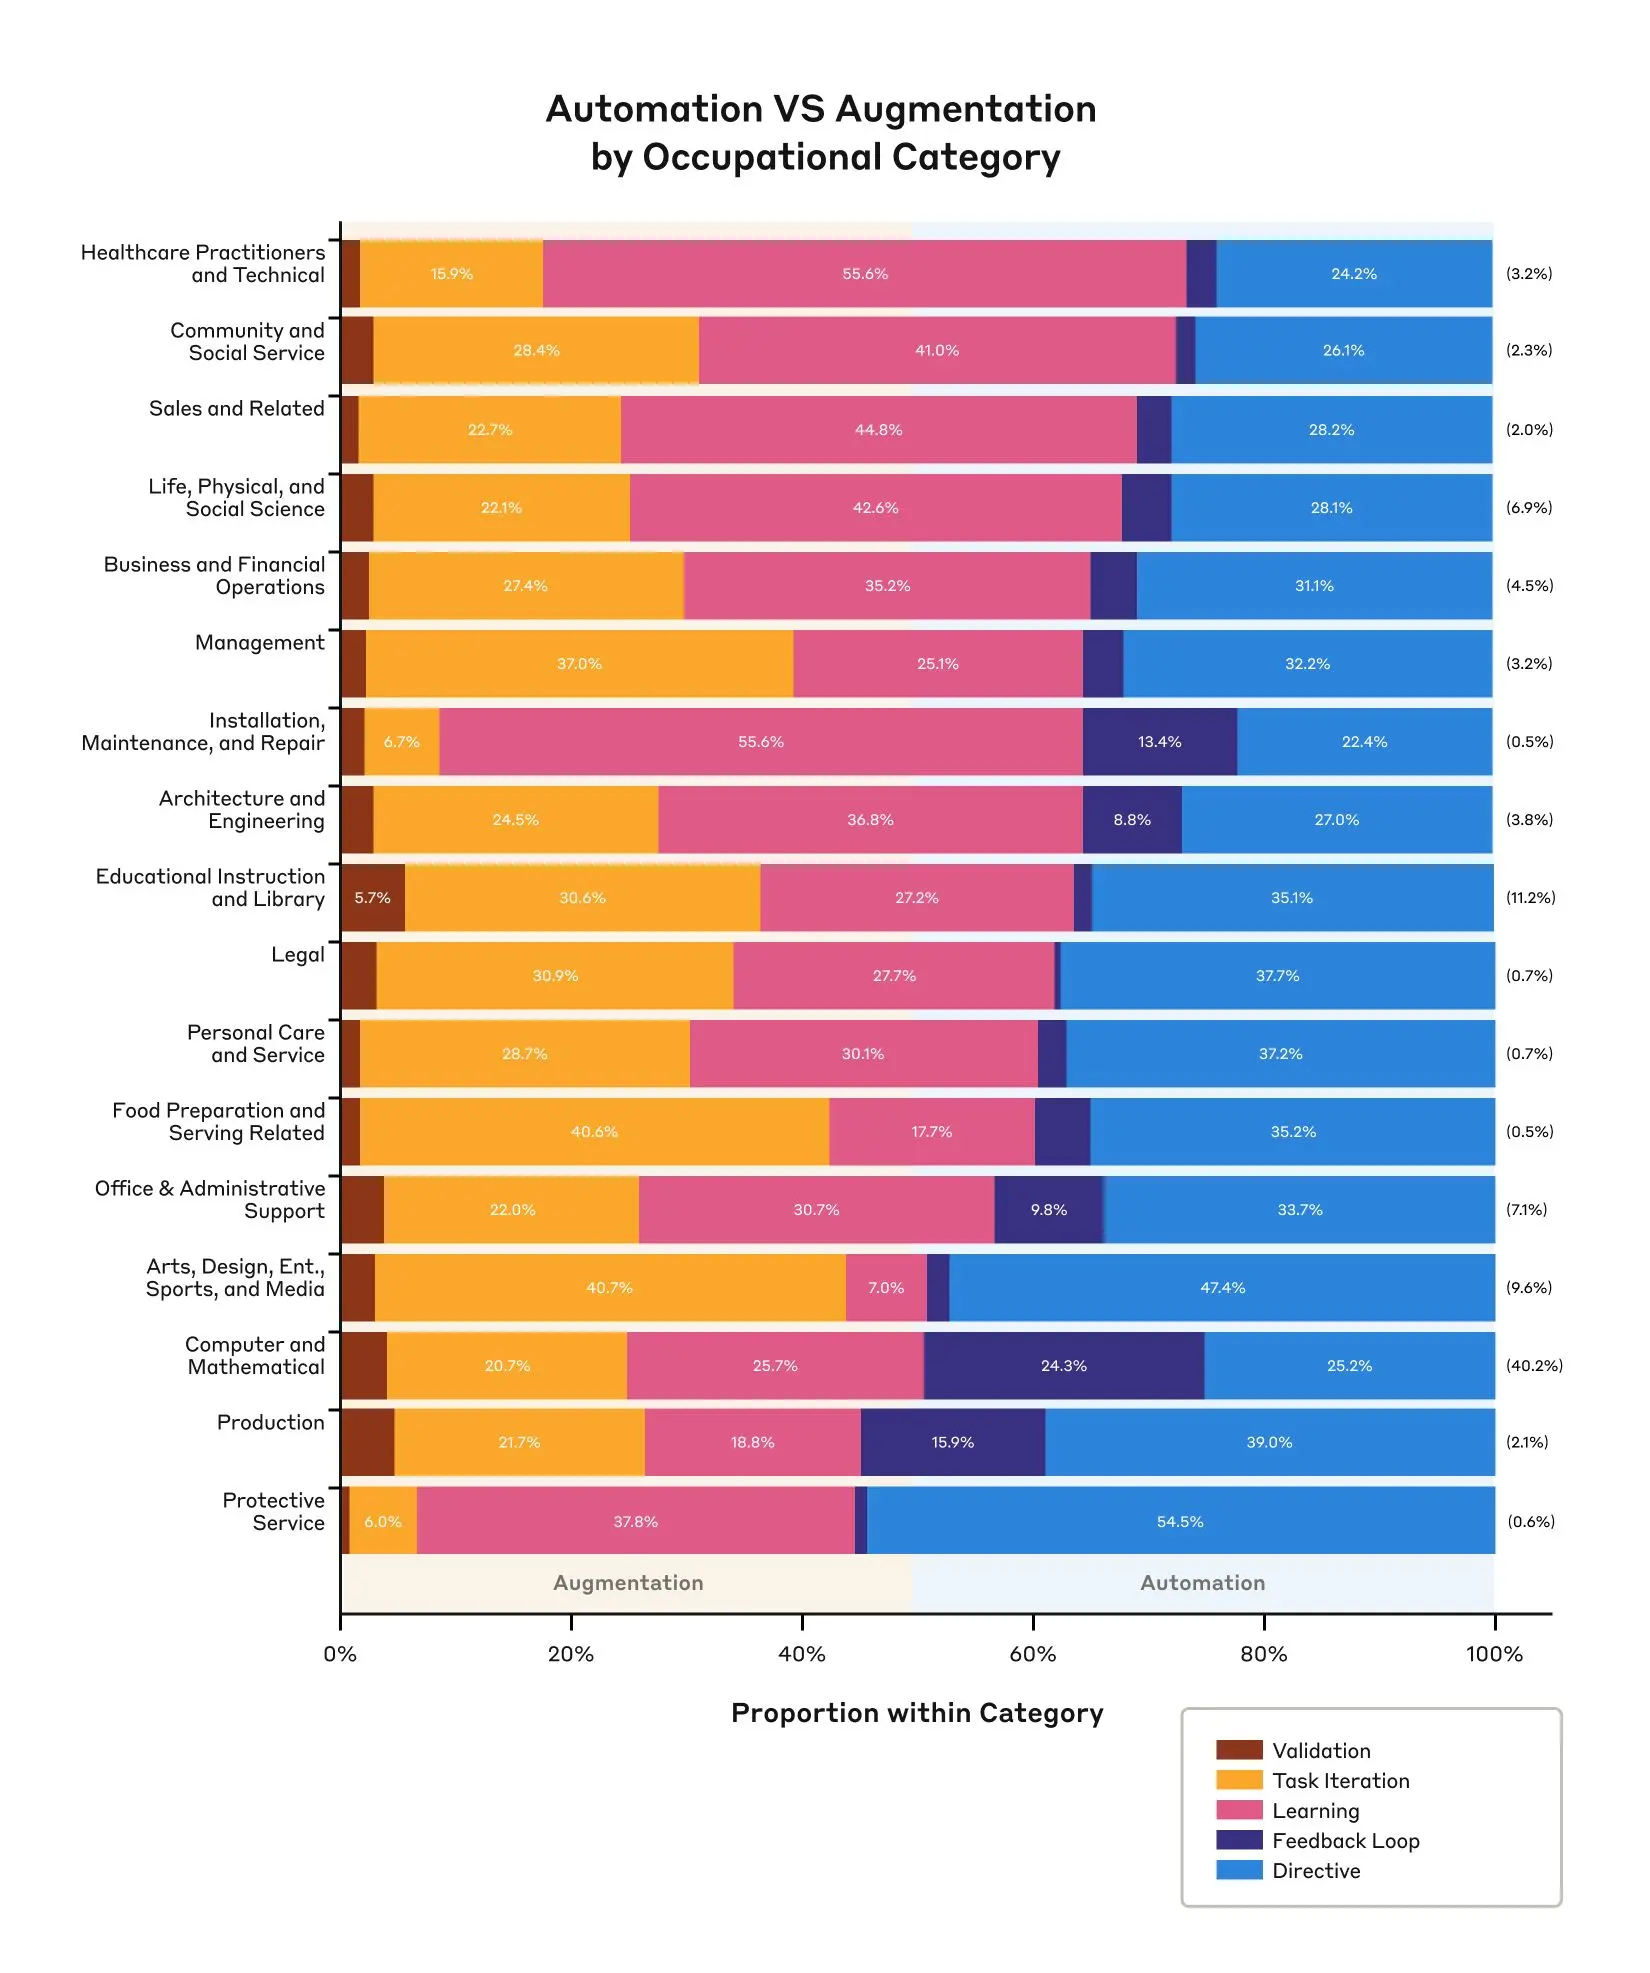
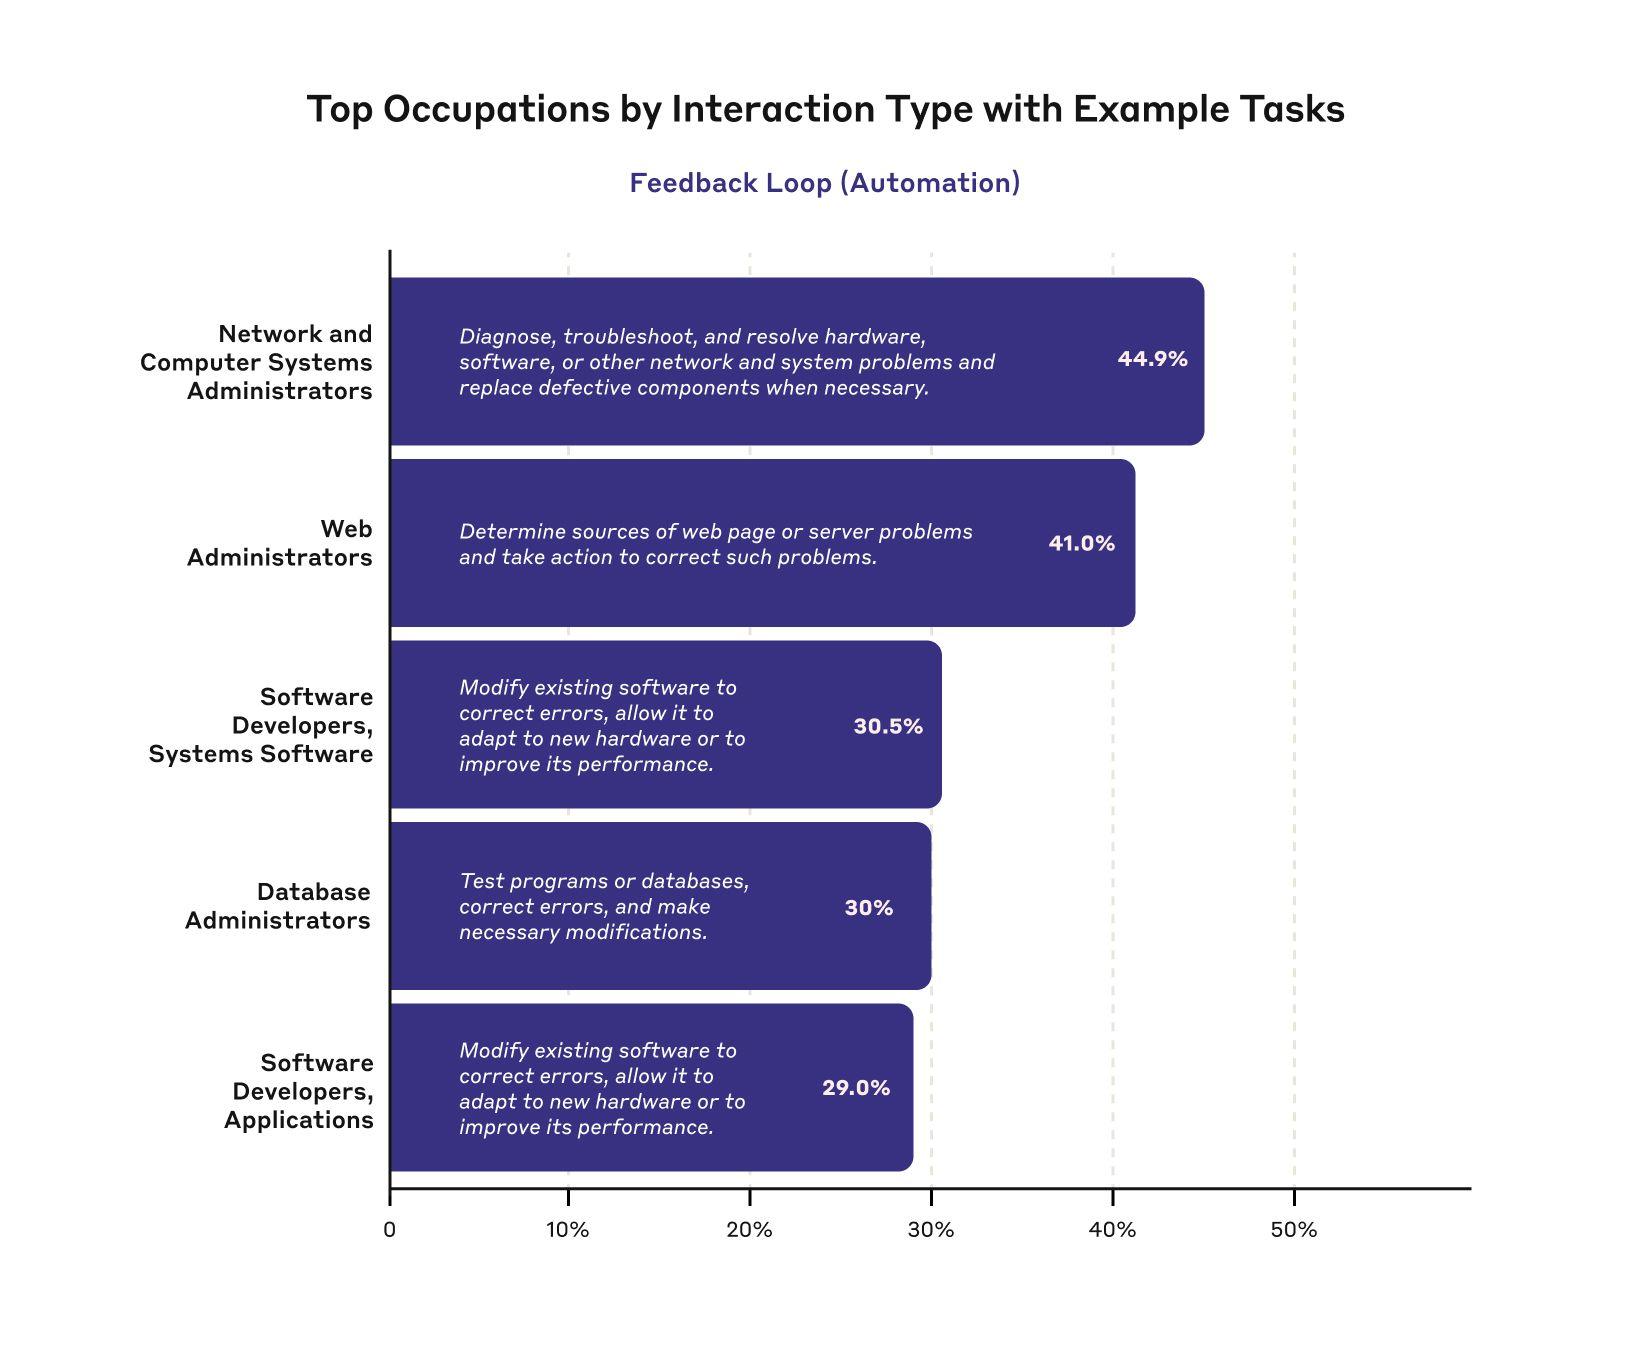
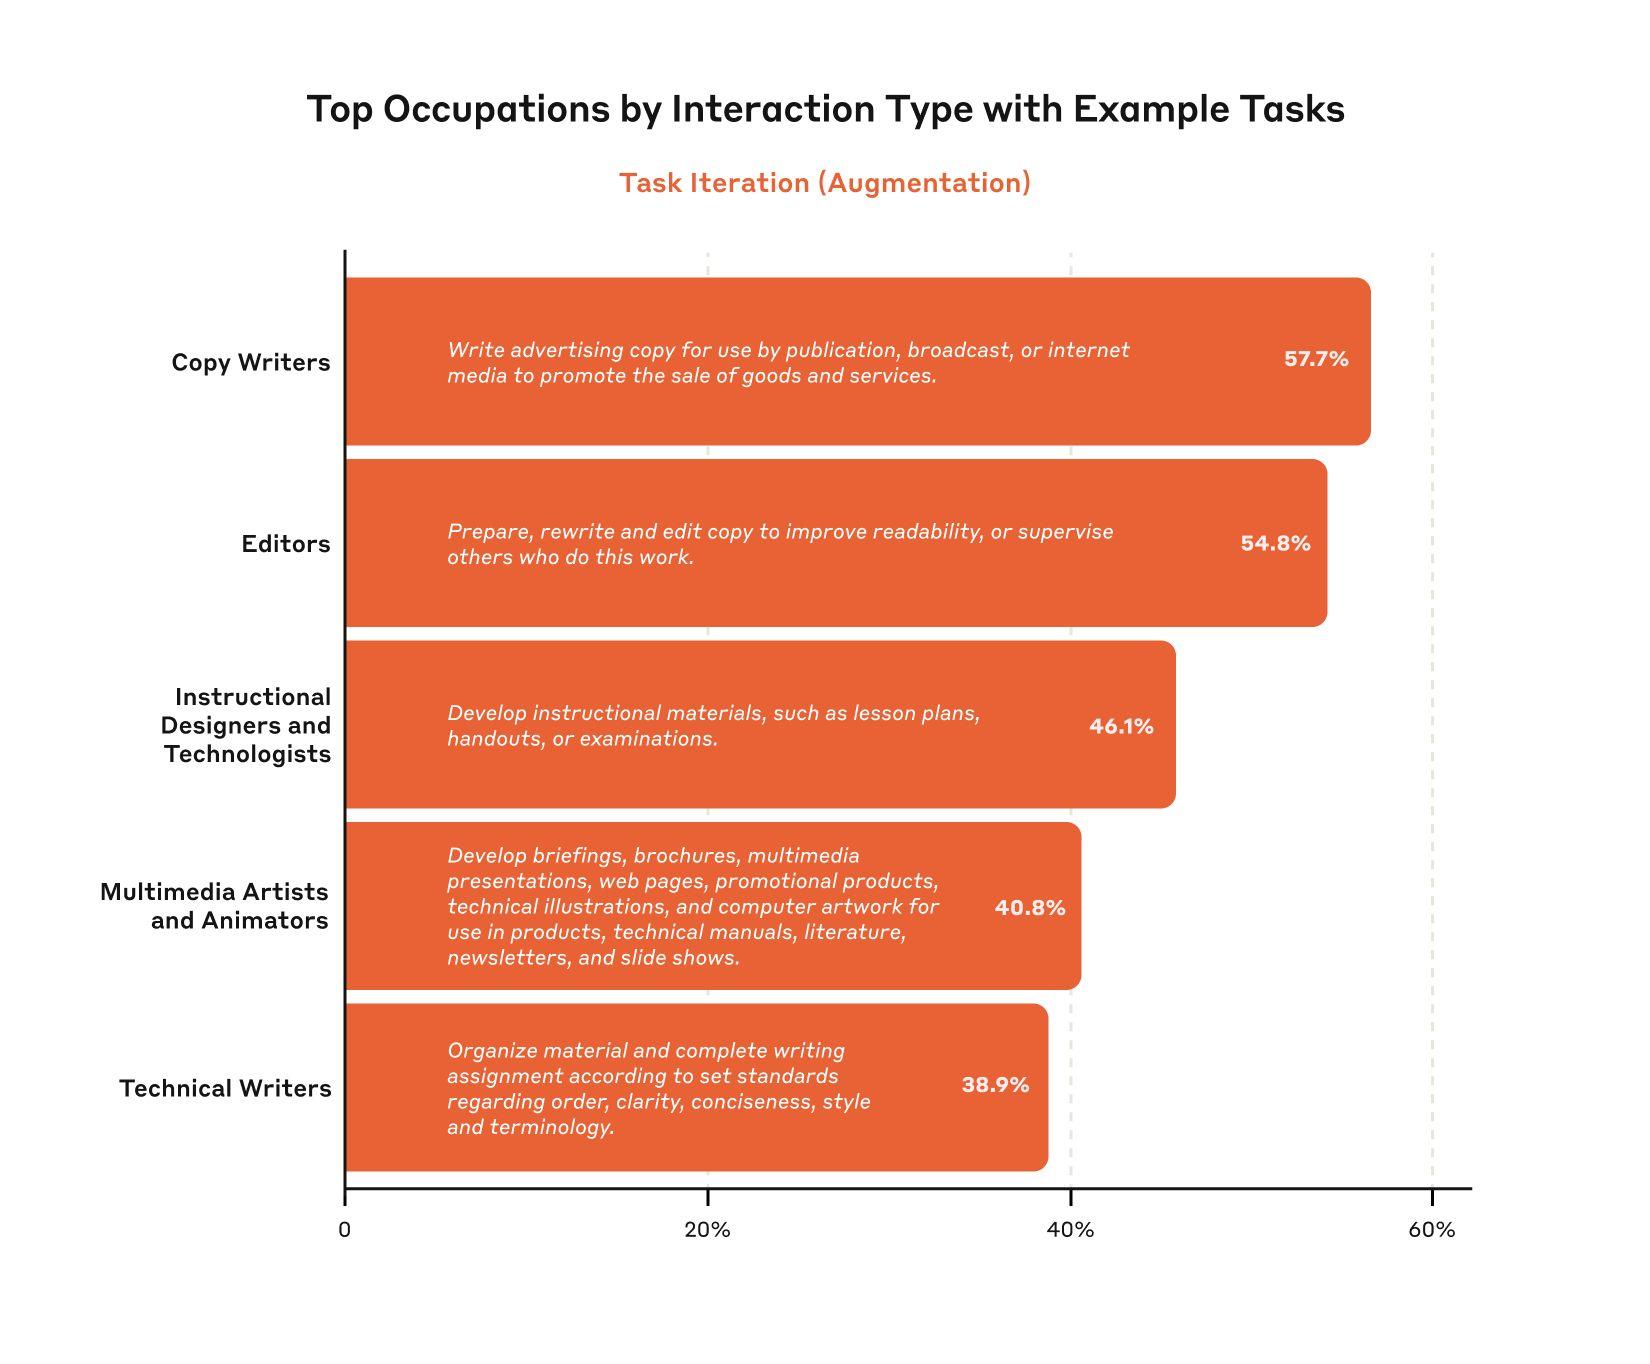
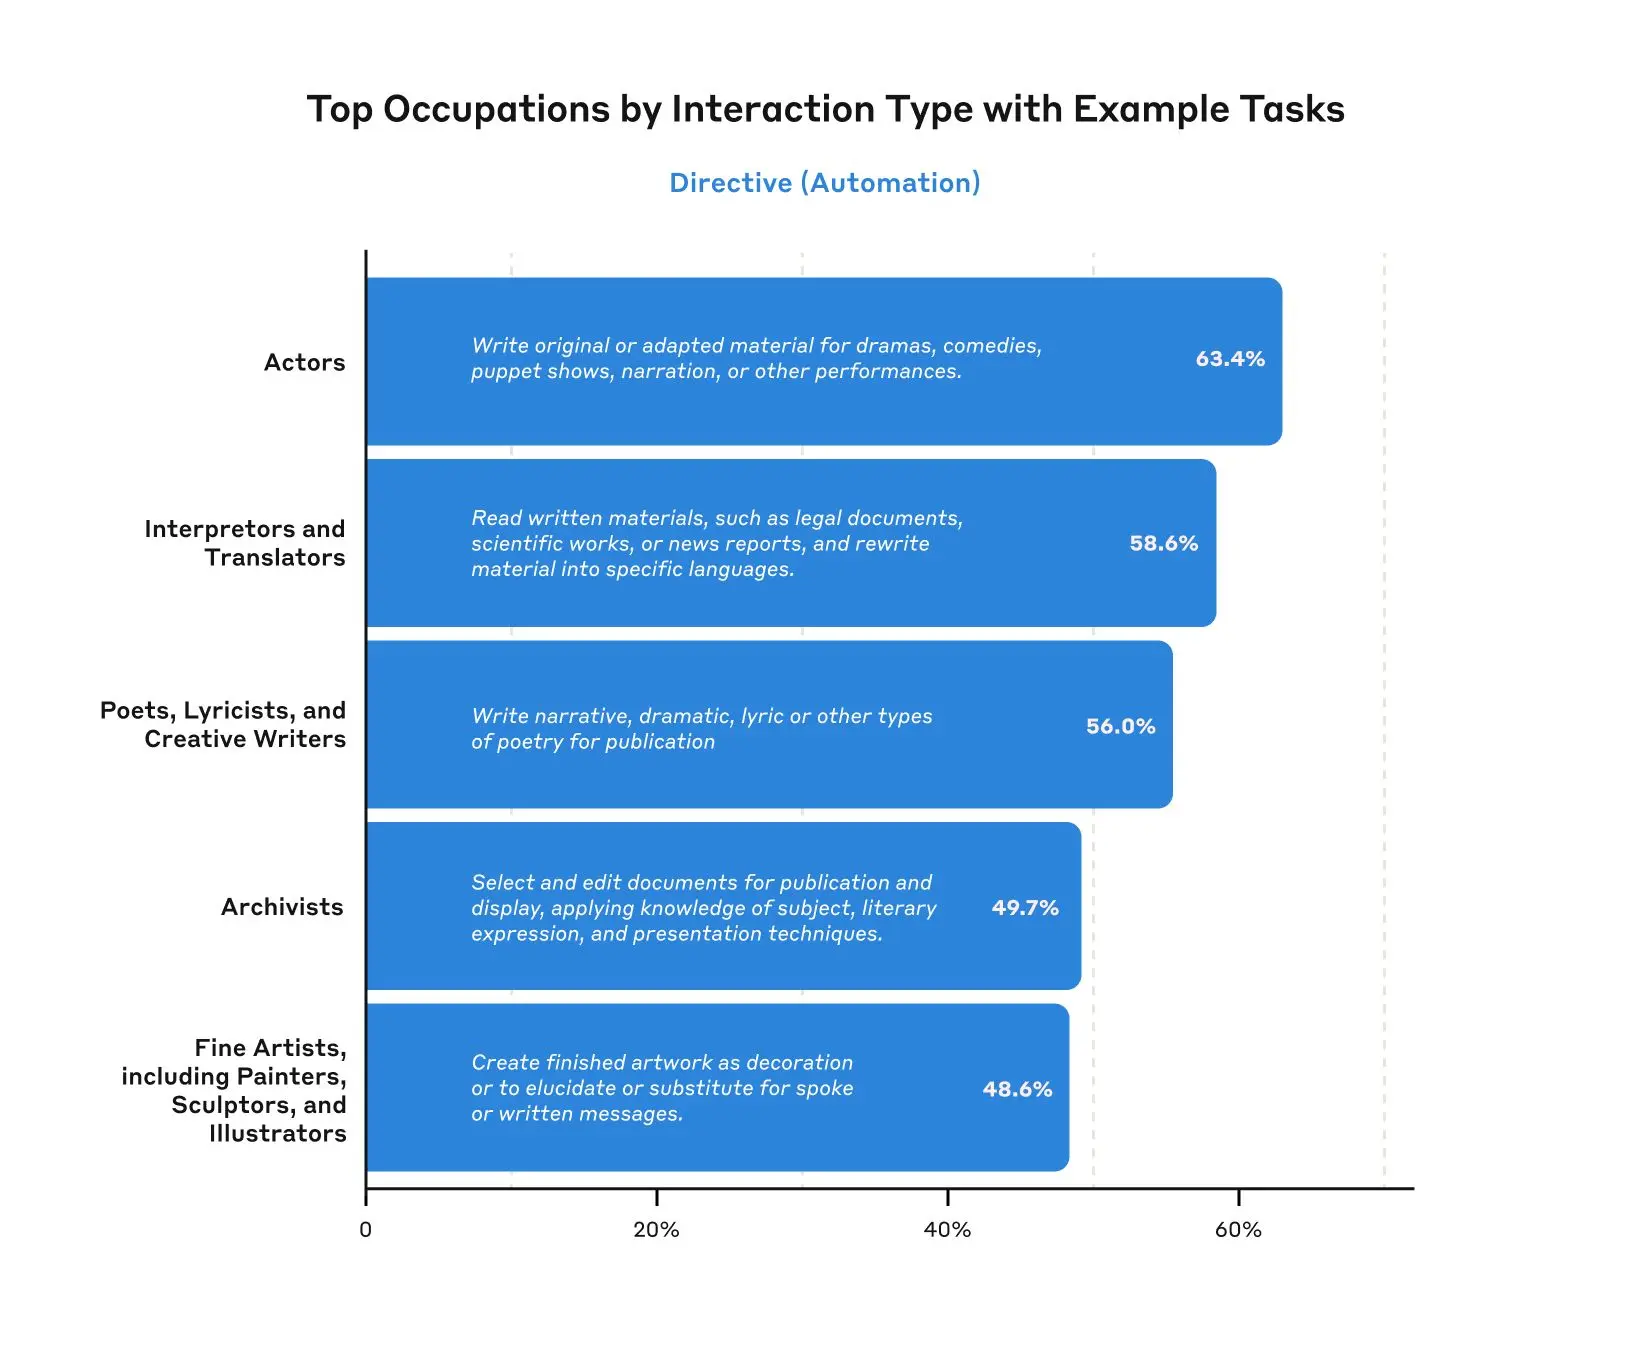
Getting more granular, we can also look at specific occupations within these occupational categories, as well as tasks associated with that occupation. For example, tasks associated with copywriters and editors show the highest amount of task iteration, where the user iterates on various writing and editing tasks with the model. By contrast, tasks associated with Translators and Interpreters show among the highest amounts of directive behavior—where the model is used for translating documents with minimal human involvement. Note that the O*NET descriptions may not be optimally representative of what Claude is being used for—for example, while we see usage in the occupation “fine artists, including painters, sculptors, and illustrators,” Claude is probably used far more for creating digital art than for painting or sculpture.
A bottom-up taxonomy of usage on Claude.ai
Our research so far has relied on the O*NET dataset of tasks and occupations, which was created and maintained by the US Department of Labor. While O*NET covers a very large number of tasks, O*NET may not be the best taxonomy to describe the capabilities of general purpose models which can be used for tasks which are not present in O*NET—and thus might be missed by our analysis.
To address this gap, we’re releasing a new bottom-up dataset of user activity patterns on Claude.ai. This dataset was also created with Clio, and uses the same dataset of anonymized conversations used for the above analysis, meaning that it enables comparisons between top-down and bottom-up approaches. It consists of 630 granular clusters, with associated descriptions, prevalence metrics, and automation/augmentation breakdowns, organized into three levels of hierarchy.
While we leave detailed analysis of this dataset to future work, we highlight a few particularly interesting clusters:
- Help with water management systems and infrastructure projects
- Create physics-based simulations with interactive visualization capabilities
- Help me with font selection, implementation, and troubleshooting
- Help me create or improve job application materials
- Provide guidance on battery technologies and charging systems
- Help with time zone handling in code and databases
Conclusion
As models continue to advance, so too must our measurement of their economic impacts. In our second report, covering data since the launch of Claude 3.7 Sonnet, we find relatively modest increases in coding, education, and scientific use cases, and no change in the balance of augmentation and automation. We find that Claude’s new extended thinking mode is used with the highest frequency in technical domains and tasks, and identify patterns in automation / augmentation patterns across tasks and occupations. We release datasets for both of these analyses.
In the coming months, we aim to continue tracking these metrics and developing new ones as capabilities improve and models continue to be applied across the economy.
Work with us
If you’re interested in working at Anthropic to research the effects of AI on the labor market, we encourage you to apply for our Societal Impacts Research Scientist and Research Engineer roles, as well as our Economist role.
Appendix
We share a few additional results and technical details in this appendix.
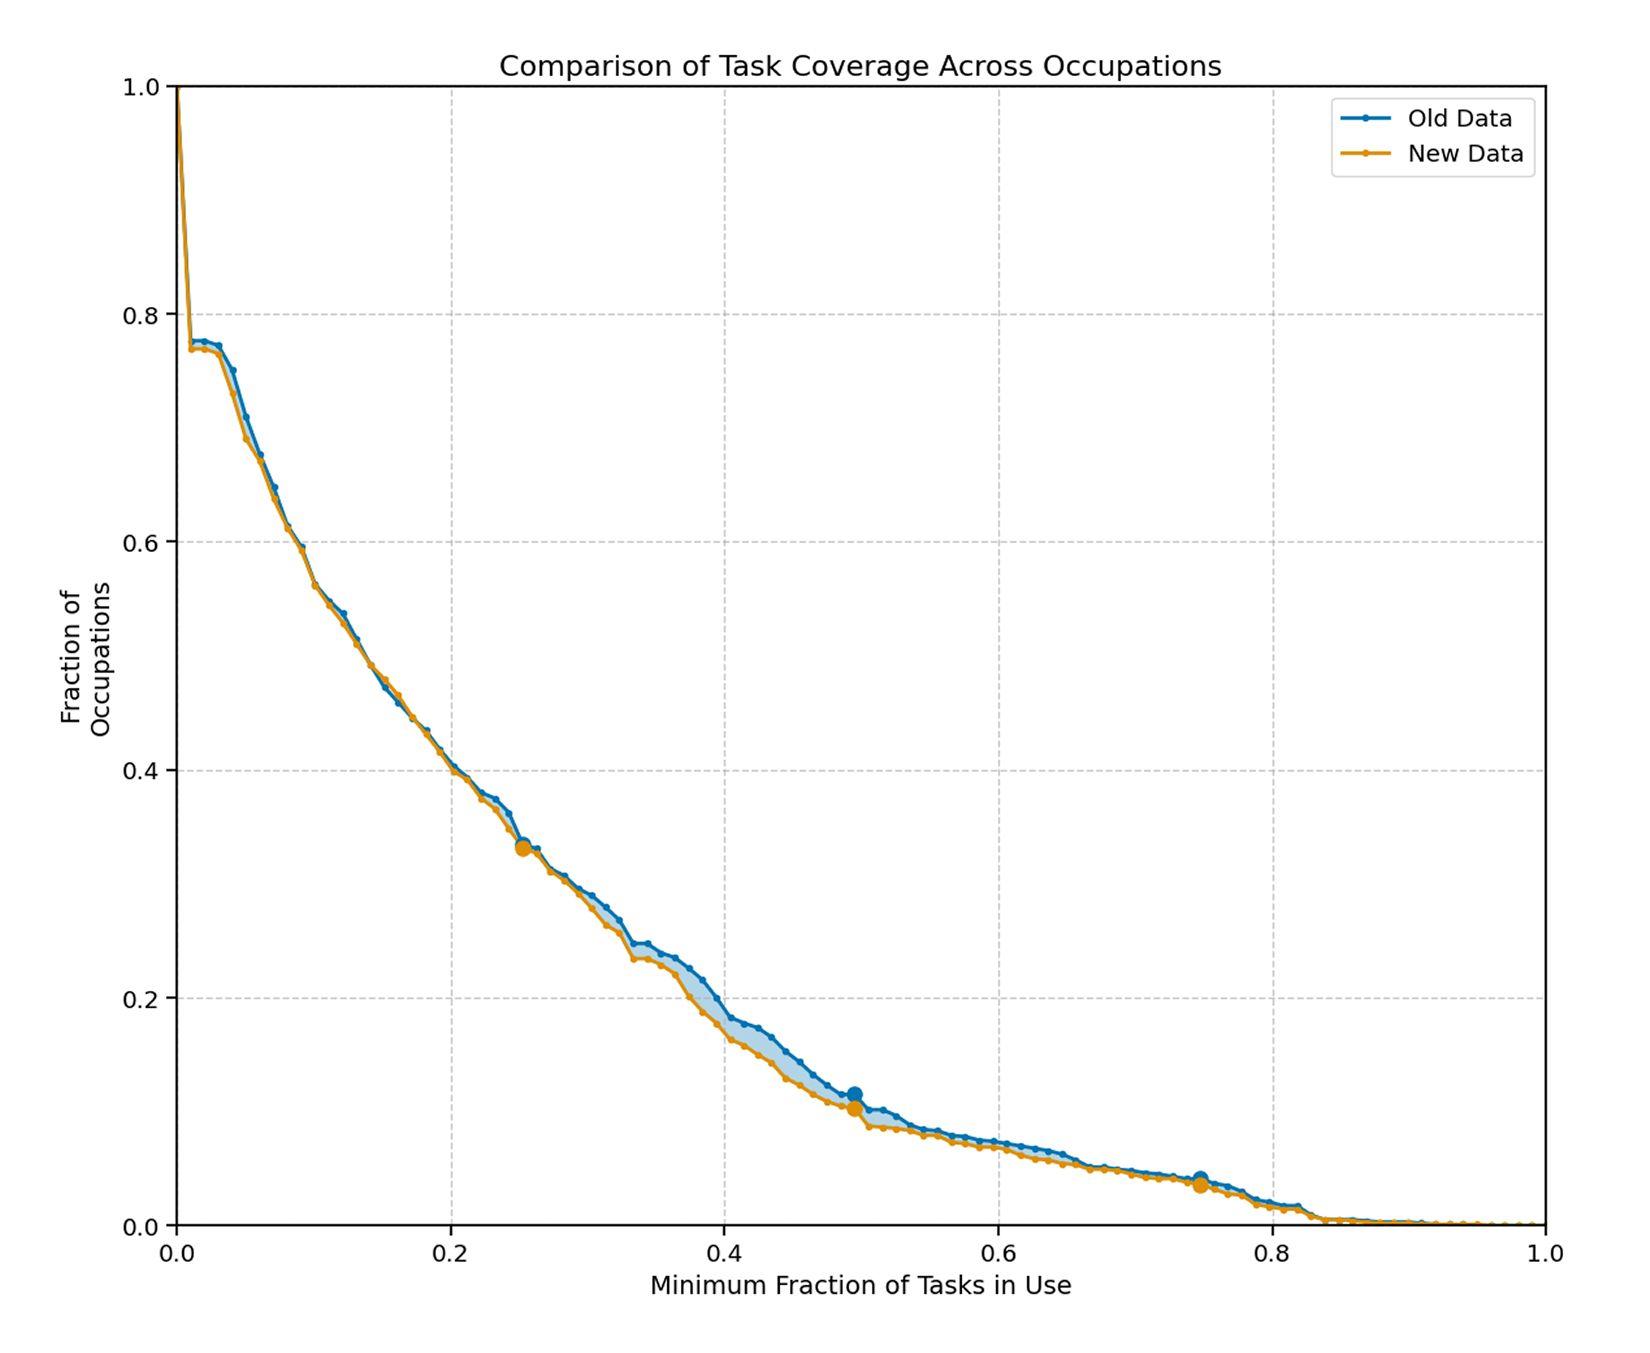
Task Curve
We also recompute the “depth of task usage” plot from our original paper. We find generally a very similar curve to our first analysis. If anything we see slightly less area under the curve for the newer model—perhaps owing to an increase in concentration in our sample of conversations towards coding. That said, while we haven’t seen a dramatic change in this curve over the last two months, we will continue to monitor as model capabilities and product surfaces continue to advance.
Full change across occupational categories
Results for other interaction modes
Additional methodological details
While we mainly follow the methodology of our original report, we make a few changes which we document here for transparency:
- In contrast to our last report, we do not filter based on whether conversations are relevant to an occupational category. Instead, we simply filter out conversations that flagged our safety classifiers. We find these approaches lead to similar results as our original analysis, while preserving more data that we can release via our bottom-up taxonomy of usage.
- We use Claude 3.7 Sonnet in place of all cases where we previously used Claude 3.5 Sonnet. We found that using our newer model increased the accuracy of classifications according to the internal benchmarks we use to assess Clio’s accuracy.