Anthropic Economic Index: New building blocks for understanding AI use
Is artificial intelligence really making people faster at work? What sort of tasks does AI support best? And how might it change the nature of people’s occupations?
At Anthropic, we’re measuring real-world AI use on an ongoing basis to answer questions exactly like these. Our privacy-preserving analysis method allows us to learn more about conversations on Claude.ai (capturing uses by consumers) and our first-party API (mostly capturing uses by businesses).1 In past reports, we’ve assessed AI tasks by occupation and wage level, looked more closely at software development, and studied AI use by country and by US state.
We’re now adding a new level of detail to our Economic Index. In our fourth report, we’re introducing what we’ve called economic primitives: a set of five simple, foundational measurements to track the economic impacts of Claude over time. Our initial set includes task complexity, skill level, purpose (work, education, or personal use), AI autonomy, and success.2 We derive these primitives from asking Claude to answer a common set of questions about every conversation in our sample for this report.
These primitives provide a leading indicator of AI’s potential economic impacts—and allow us to answer far more complex questions about how AI is already changing jobs. Our latest report, which samples conversations from November 2025 (predominantly using Claude Sonnet 4.5), uses our primitives to explore a wide range of questions that we wouldn’t otherwise be able to answer—including how Claude’s task-level success rates change for more complex tasks, and whether the use of Claude to date might portend a net-deskilling effect on many jobs.
You can read the fourth Economic Index report here. Below, we summarize its results.
What we’ve learned from our economic primitives
We applied our economic primitives to questions about individual tasks, occupations, and then the possible aggregate impacts of the changes we observe. (Our full methodology—including details on how we tested the accuracy of our primitives—is described in chapter two of the full report.)
Tasks
Which tasks does AI speed up, and by how much?
We found that more complex tasks were sped up the most by Claude. We measure this by what Claude estimates as the number of years of schooling required to understand the conversation’s inputs: in Claude.ai, tasks with prompts requiring a high school education (12 years) were sped up by a factor of 9, while those requiring a college degree (16 years) were sped up by a factor of 12. (On the API, the speedup was greater still.) These results imply that AI’s productivity gains are currently accruing in tasks that require relatively high human capital, which is consistent with the evidence that white collar professionals are more likely to use AI at work.
This same trend holds—albeit in weaker form—when we adjust for tasks’ success rates. Claude successfully completes tasks that require a college degree 66% of the time, compared to 70% for those tasks that require less than a high school education. This reduces, but doesn’t eliminate, the overall effect: Claude’s impact on task speedup scales more sharply with complexity than complexity correlates with a decrease in success rate.

What are the time horizons over which Claude can support tasks?
METR’s measure of AI’s task horizons shows that longer tasks are harder for AI models to complete. But the length of time over which AI models can work is steadily increasing as models get better: this measure has now become a key indicator of AI progress.
We’re able to complement METR’s analysis using our economic primitives. In the graph below, we show Claude’s task-level success rates relative to the amount of time a human would take to do the same task, both on Claude.ai and on our API:
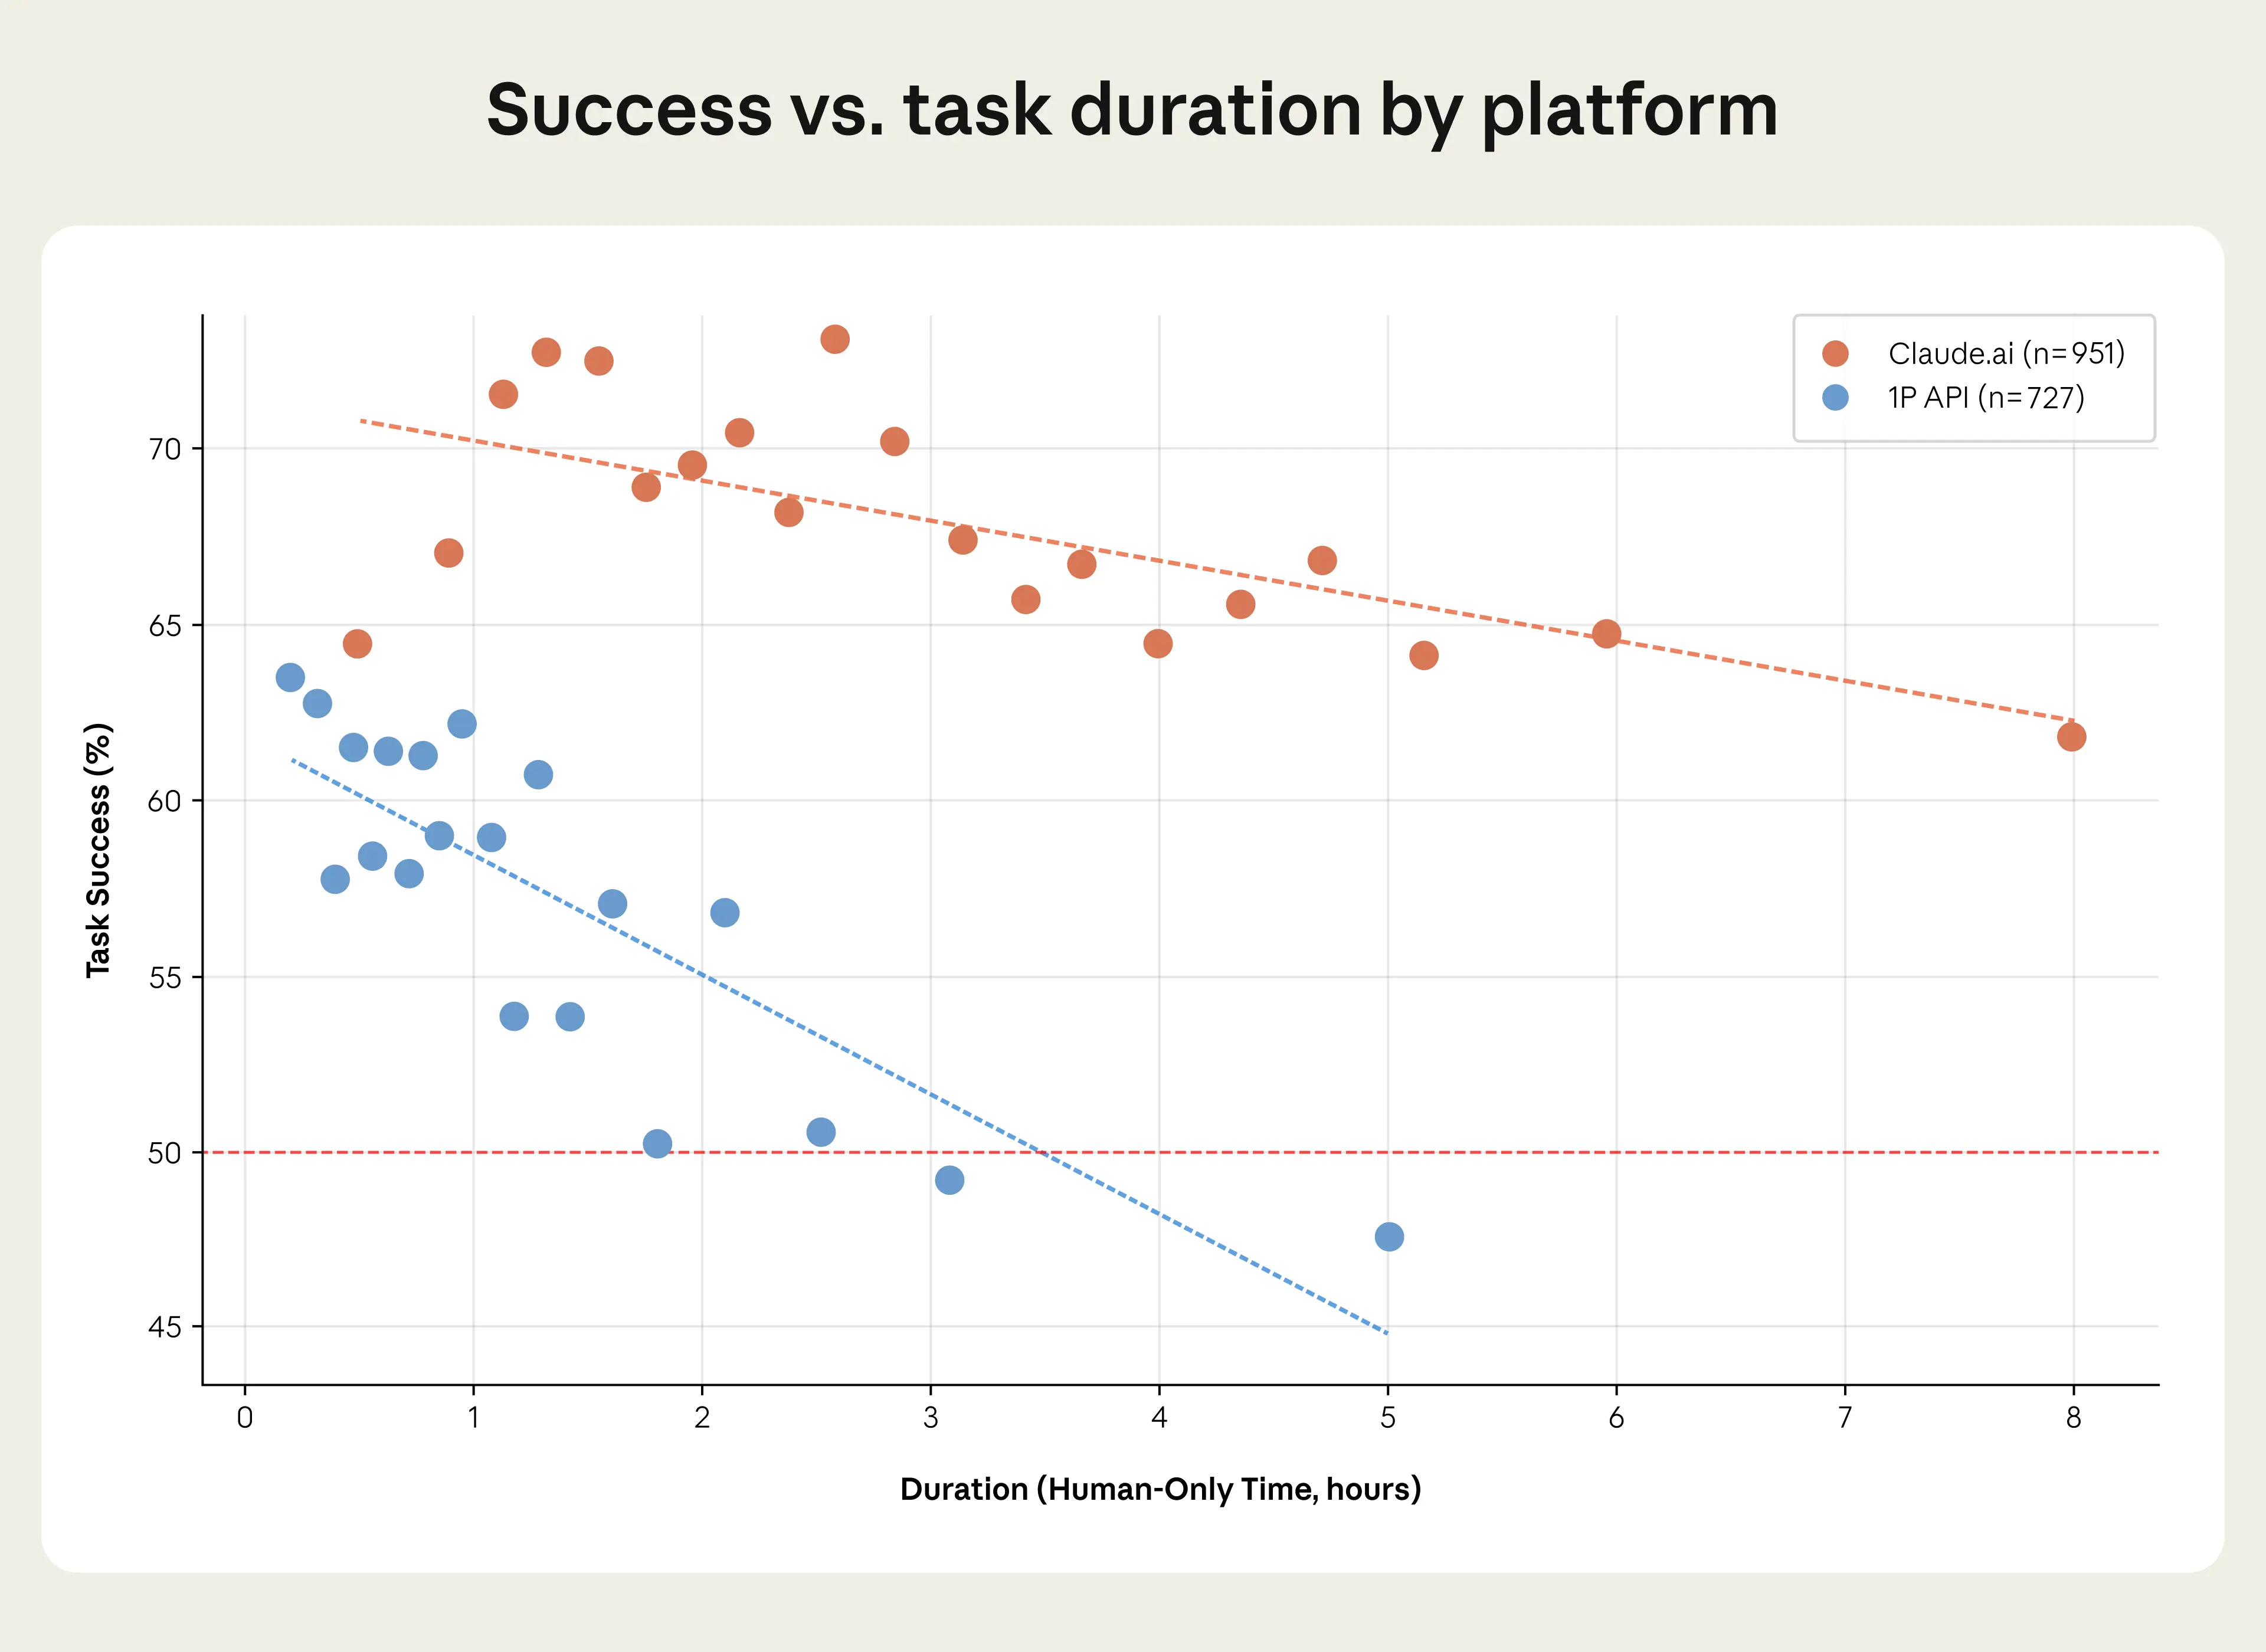
METR’s benchmark suggests that Claude Sonnet 4.5 (the model in our own analysis) achieves 50% success rates on tasks of 2 hours. By contrast, our own API data finds that Claude is 50% successful at tasks that take nearly twice as long (around 3.5 hours), and on Claude.ai, the duration is vastly longer still—around 19 hours. But this might not be as discordant as it seems: our methodology is different to METR’s in some important ways. In our sample, users can break down complex tasks into smaller steps, creating a feedback loop that allows Claude to correct course. And rather than a fixed set of tasks, our sample contains a form of selection bias: users bring tasks to Claude that they’re more confident will work.
Our analysis shows how Claude’s effective time horizons might look different to those found in a study with a consistent set of tasks. We’ll track this indicator in further reports.
How does the nature of Claude’s work vary across countries?
We find that Claude completes very different kinds of tasks in countries at different stages of economic development. In countries with higher GDP per capita, Claude is used much more frequently for work or for personal use—whereas countries at the other end of the spectrum are more likely to use it for educational coursework. This fits a straightforward “adoption curve” story, in which lower-income countries show a large share of AI use on education and on a smaller number of work tasks, while AI use diversifies towards personal purposes as countries become richer.
These results align with recent work by Microsoft that associates AI use in education with lower per-capita income, and AI use for leisure with higher incomes. Our recent partnership with the Rwandan government and ALX, a technology training provider, is designed with this in mind: participants begin by developing AI literacy, and we’re piloting a program for granting some graduates year-long access to Claude Pro, supporting the transition from educational use to a broader range of applications.

Occupations
Coverage
In our first report, with data from January 2025, we found that 36% of jobs in our sample saw Claude being used for at least a quarter of their tasks. Pooling data across reports, this has risen to 49%. But once we account for Claude’s success rate (which we weight according to how often workers do that task and how long the task takes), we get a different picture of which jobs are most affected by the use of AI.
On the graph below, we plot that earlier measure of occupations’ task coverage along the x axis, and our new, adjusted measure on the y axis. Although the two are certainly correlated, we now find that some occupations (like data entry keyers and radiologists) are much more heavily affected by AI than task coverage alone would suggest, while others (like teachers and software developers) are relatively less affected.

That said, even our revised assessment is still limited: we only assess tasks that are performed on Claude.ai, and it’s not always clear how these conversations might map onto changes in the real world. This is an area we plan to dig into further in future.
Task content
A further question we asked is whether the tasks that AI covers represent the higher- or the lower-skilled components of a given occupation. Using an estimate that we create of the skill level required for each task, we find that Claude is relatively more likely to cover the tasks that require higher education levels—specifically, tasks that require an average of 14.4 years of education (equivalent to a US associate’s degree), relative to the economy’s average of 13.2 (shown below). This aligns with our earlier finding that Claude is used more frequently by white-collar workers.

As an experiment, we estimated how removing these Claude-covered tasks would shift the task composition of people’s jobs. As a first-order effect, this would deskill jobs on average, since it would remove those higher-education tasks. Professions like technical writers, travel agents, and teachers would be affected (as we discuss further in the report), though a rarer few (like real estate managers) would see effects going the other way.
We’re not necessarily predicting that this deskilling will occur: it’s possible that even if AI fully automated the tasks it currently supports, the labor market would dynamically adjust in ways that this analysis doesn’t account for. (Of course, as models improve, the composition of tasks that AI covers will change, too.) That said, we think this offers a useful signal as to the most immediate effects that AI might have on occupations in the near future.3
Aggregate impact
In our earlier research, we estimated that the widespread adoption of AI could increase US labor productivity growth by 1.8 percentage points per year over the next ten years—around double the trend rate. Our new primitives allow us to revisit this analysis.
Based on our estimates of task speedups alone, we replicated our earlier finding of a 1.8 percentage point increase (even when we added in our API data). But when we account for task reliability—that is, when we adjust our estimate of task-level time savings by the probability that the task is successful, our estimate falls by about one-third for tasks completed on Claude.ai (to 1.2 percentage points per year), and by slightly more (to 1.0 percentage points) for the typically more challenging tasks completed on our API.
Even a 1 percentage point increase in annual labor productivity growth would still be notable: it would return US productivity growth to the rates of the late 1990s and early 2000s. And, as we mentioned in our earlier research, this top-line estimate does not account for the possibilities that AI models become much more powerful, or that the use of AI at work becomes much more sophisticated—which could push the number much higher. Indeed, since our survey, Claude has become substantially more powerful, with the release of Claude Opus 4.5.
Updates on our previous measures
In addition to our primitives, we collected a new round of data on the measures we’ve been tracking in our previous reports. This allows us to pick out trends in AI use over the course of 2025, from January to November. Here, we mostly find only small evolutions from the results of previous analyses, which pointed to an uneven distribution of Claude use.
First, we find that the use of Claude has remained highly concentrated among certain tasks: even though our sample includes 3,000 unique work tasks on Claude.ai, the top ten account for 24% of the set, which has steadily increased from 21% in January 2025. More specifically, computer and mathematical tasks continue to dominate Claude use: they’re about a third of all conversations on Claude.ai, and nearly half of our API traffic.
Second, our new report finds that augmentation (52% of conversations) has overtaken automation (45%) as the most popular pattern of interaction with Claude on Claude.ai. This is a reversal of what we saw in our August sample (when automation led by 49% to 47%), but, when we assess this question over a longer time-frame, we still see a slow rise in automation’s share of tasks: augmentation led by 55% to 41% in January of last year, and by 55% to 42% in March.
Third, our latest analysis shows that the geographic concentration of AI use (as we discussed last time) remains evident. The US, India, Japan, the UK, and South Korea still lead in overall Claude.ai use, and adoption remains well-explained by GDP per capita. That said, in the US, we’ve observed greater changes: Claude use has become noticeably more evenly distributed across US states. In fact, if this trend was sustained, our model predicts that Claude use would be equalized across the country within two to five years. We discuss this model in more detail in the report.
Conclusion
The most immediate conclusion from our latest Economic Index report is that the impact of AI on the global workforce remains a highly uneven one: AI use remains concentrated in specific countries and occupations, and it affects some occupations in a very different way to others, as the evidence on task coverage suggests.
More generally, this report has given us a new baseline against which to compare our future surveys. As Claude improves, we expect it’ll be asked to take on harder tasks, and that it’ll likely find greater success. We also expect that tasks might move from Claude.ai to the API (that is, from predominantly consumers to predominantly businesses) as they become more reliable—and if this happens, it’ll give us another possible indication of coming economic impacts, given the importance of business adoption for AI’s effect on productivity. Through our primitives, we’ll be able to measure how changes like these are beginning to impact real-world outcomes, including the nature of people’s work, and which people (and where) are likely to be most affected during this period of rapid technological transition.
In the meantime, researchers, journalists, and the public can use our data to inform their own research and thinking, and to provide an empirical foundation for the potential policy responses we might need. For much more detail on each of the areas we’ve discussed above, see our full report.
Footnotes
- As with previous reports, all our analysis is based on privacy-preserving analysis. Throughout the report we analyze a random sample of 1M conversations from Claude.ai Free, Pro and Max conversations (we also refer to this as “consumer data” since it mostly represents consumer use) and 1M transcripts from our first-party (1P) API traffic (we also refer to this as “enterprise data” since it mostly represents enterprise use).
- More specifically,
- Task complexity captures that tasks can vary in their complexity, including how long they take to complete and how difficult they are. A "debugging" task in O*NET could refer to Claude fixing a small error in a function or comprehensively refactoring a codebase—with very different implications for labor demand. We measure complexity through estimated human time to complete tasks without AI, time spent completing tasks with AI, and whether users handle multiple tasks within a single conversation.
- Human and AI skills address how automation interacts with skill levels. If AI disproportionately substitutes for tasks requiring less expertise while complementing higher-skilled work, it could be another form of skill-biased technical change—increasing demand for highly skilled workers while displacing lower skilled workers. We measure whether users could have completed tasks without Claude, and the years of education needed to understand both user prompts and Claude's responses.
- Use case distinguishes professional, educational, and personal use. Labor market effects most directly follow from workplace use, while educational use may signal where the future workforce is building AI-complementary skills.
- AI autonomy measures the degree to which users delegate decision-making to Claude. Our latest report documented rising "directive" use where users delegate tasks entirely. Tracking autonomy levels—from active collaboration to full delegation—helps forecast the pace of automation.
- Task success measures Claude’s assessment of whether Claude completes tasks successfully. Task success helps assess whether tasks can be automated effectively (can a task be automated at all?) and efficiently (how many attempts would it take to automate a task?). That is, task success matters for both the feasibility and the cost of automating labor tasks.
- Indeed, some historical evidence suggests that when technologies automating job tasks appear in patent data, employment and wages subsequently fall for exposed occupations.
Related content
How Canada uses Claude: Findings from the Anthropic Economic Index
Read moreClaude’s values across models and languages
Read moreClaude plays robotics
In project Fetch, we examined how humans can use models to get robots to perform complex tasks. Now, we investigate many models on a large variety of different robotics tasks in simulation, to see how good models are at controlling robots themselves.
Read more